Interaction of Spatial and Social Structure
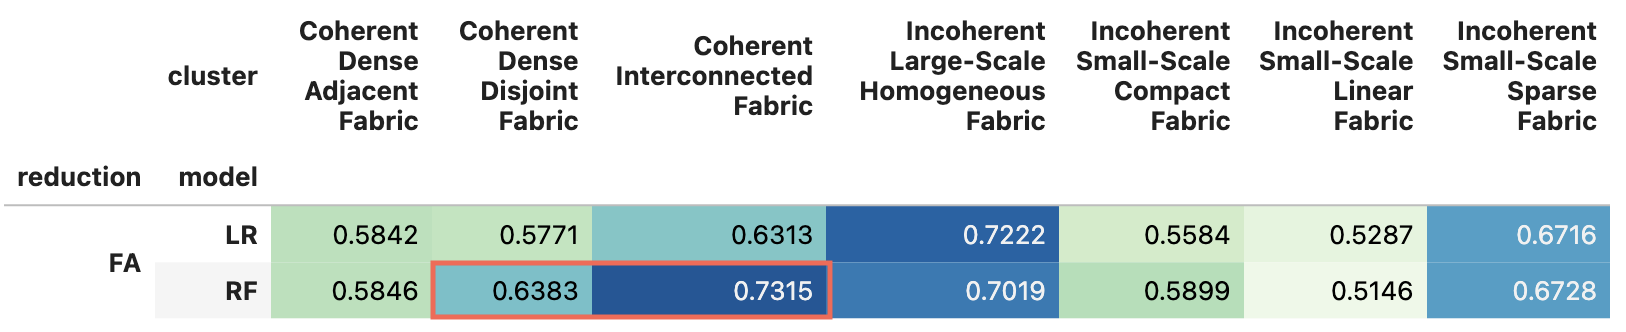
Coherent Interconnected Fabric
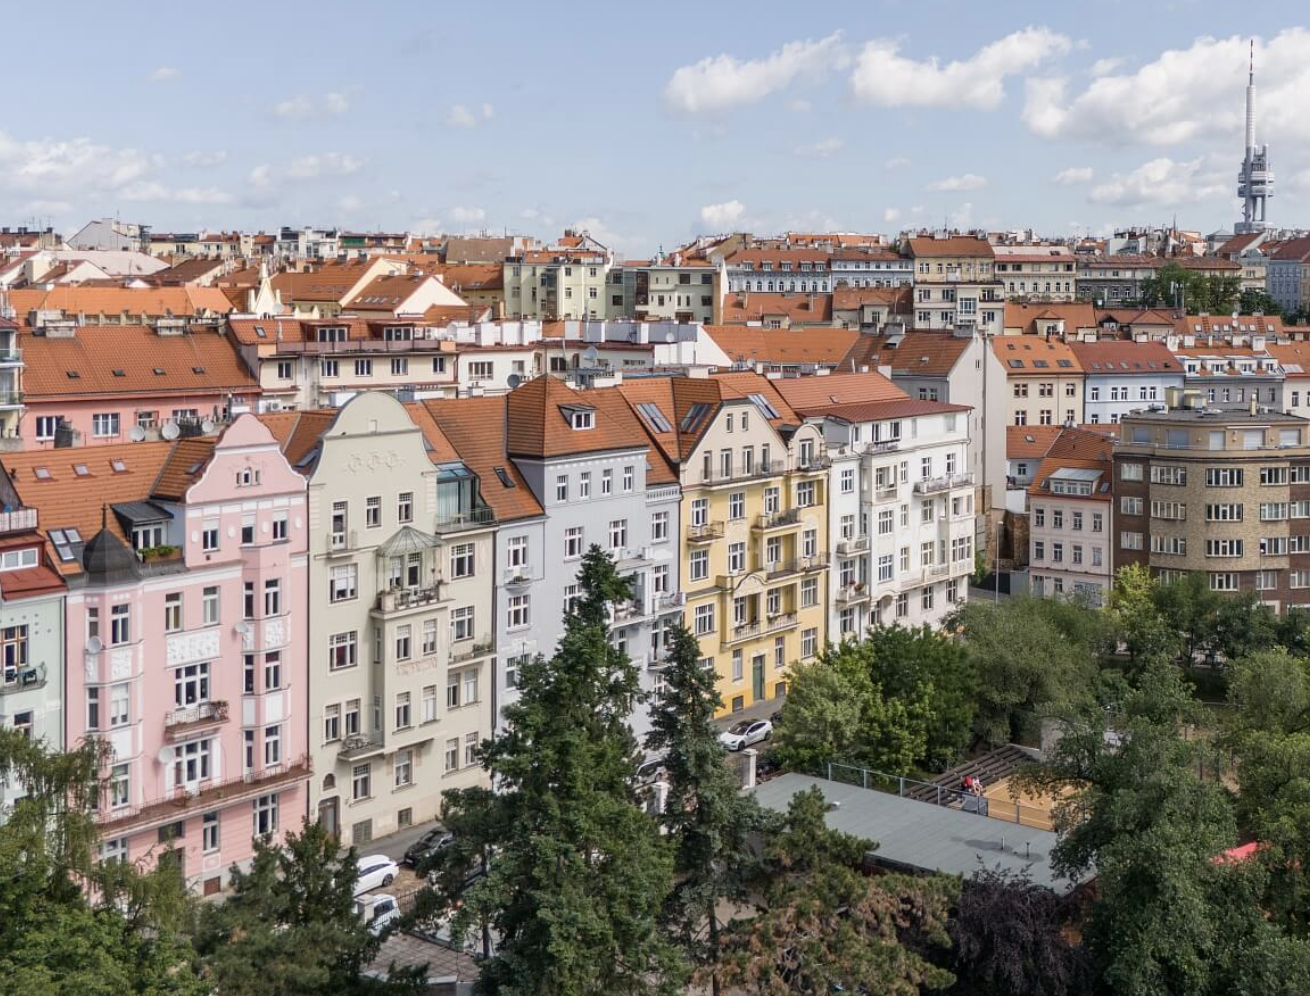
Coherent Dense Adjacent Fabric
Coherent Dense Disjoint Fabric
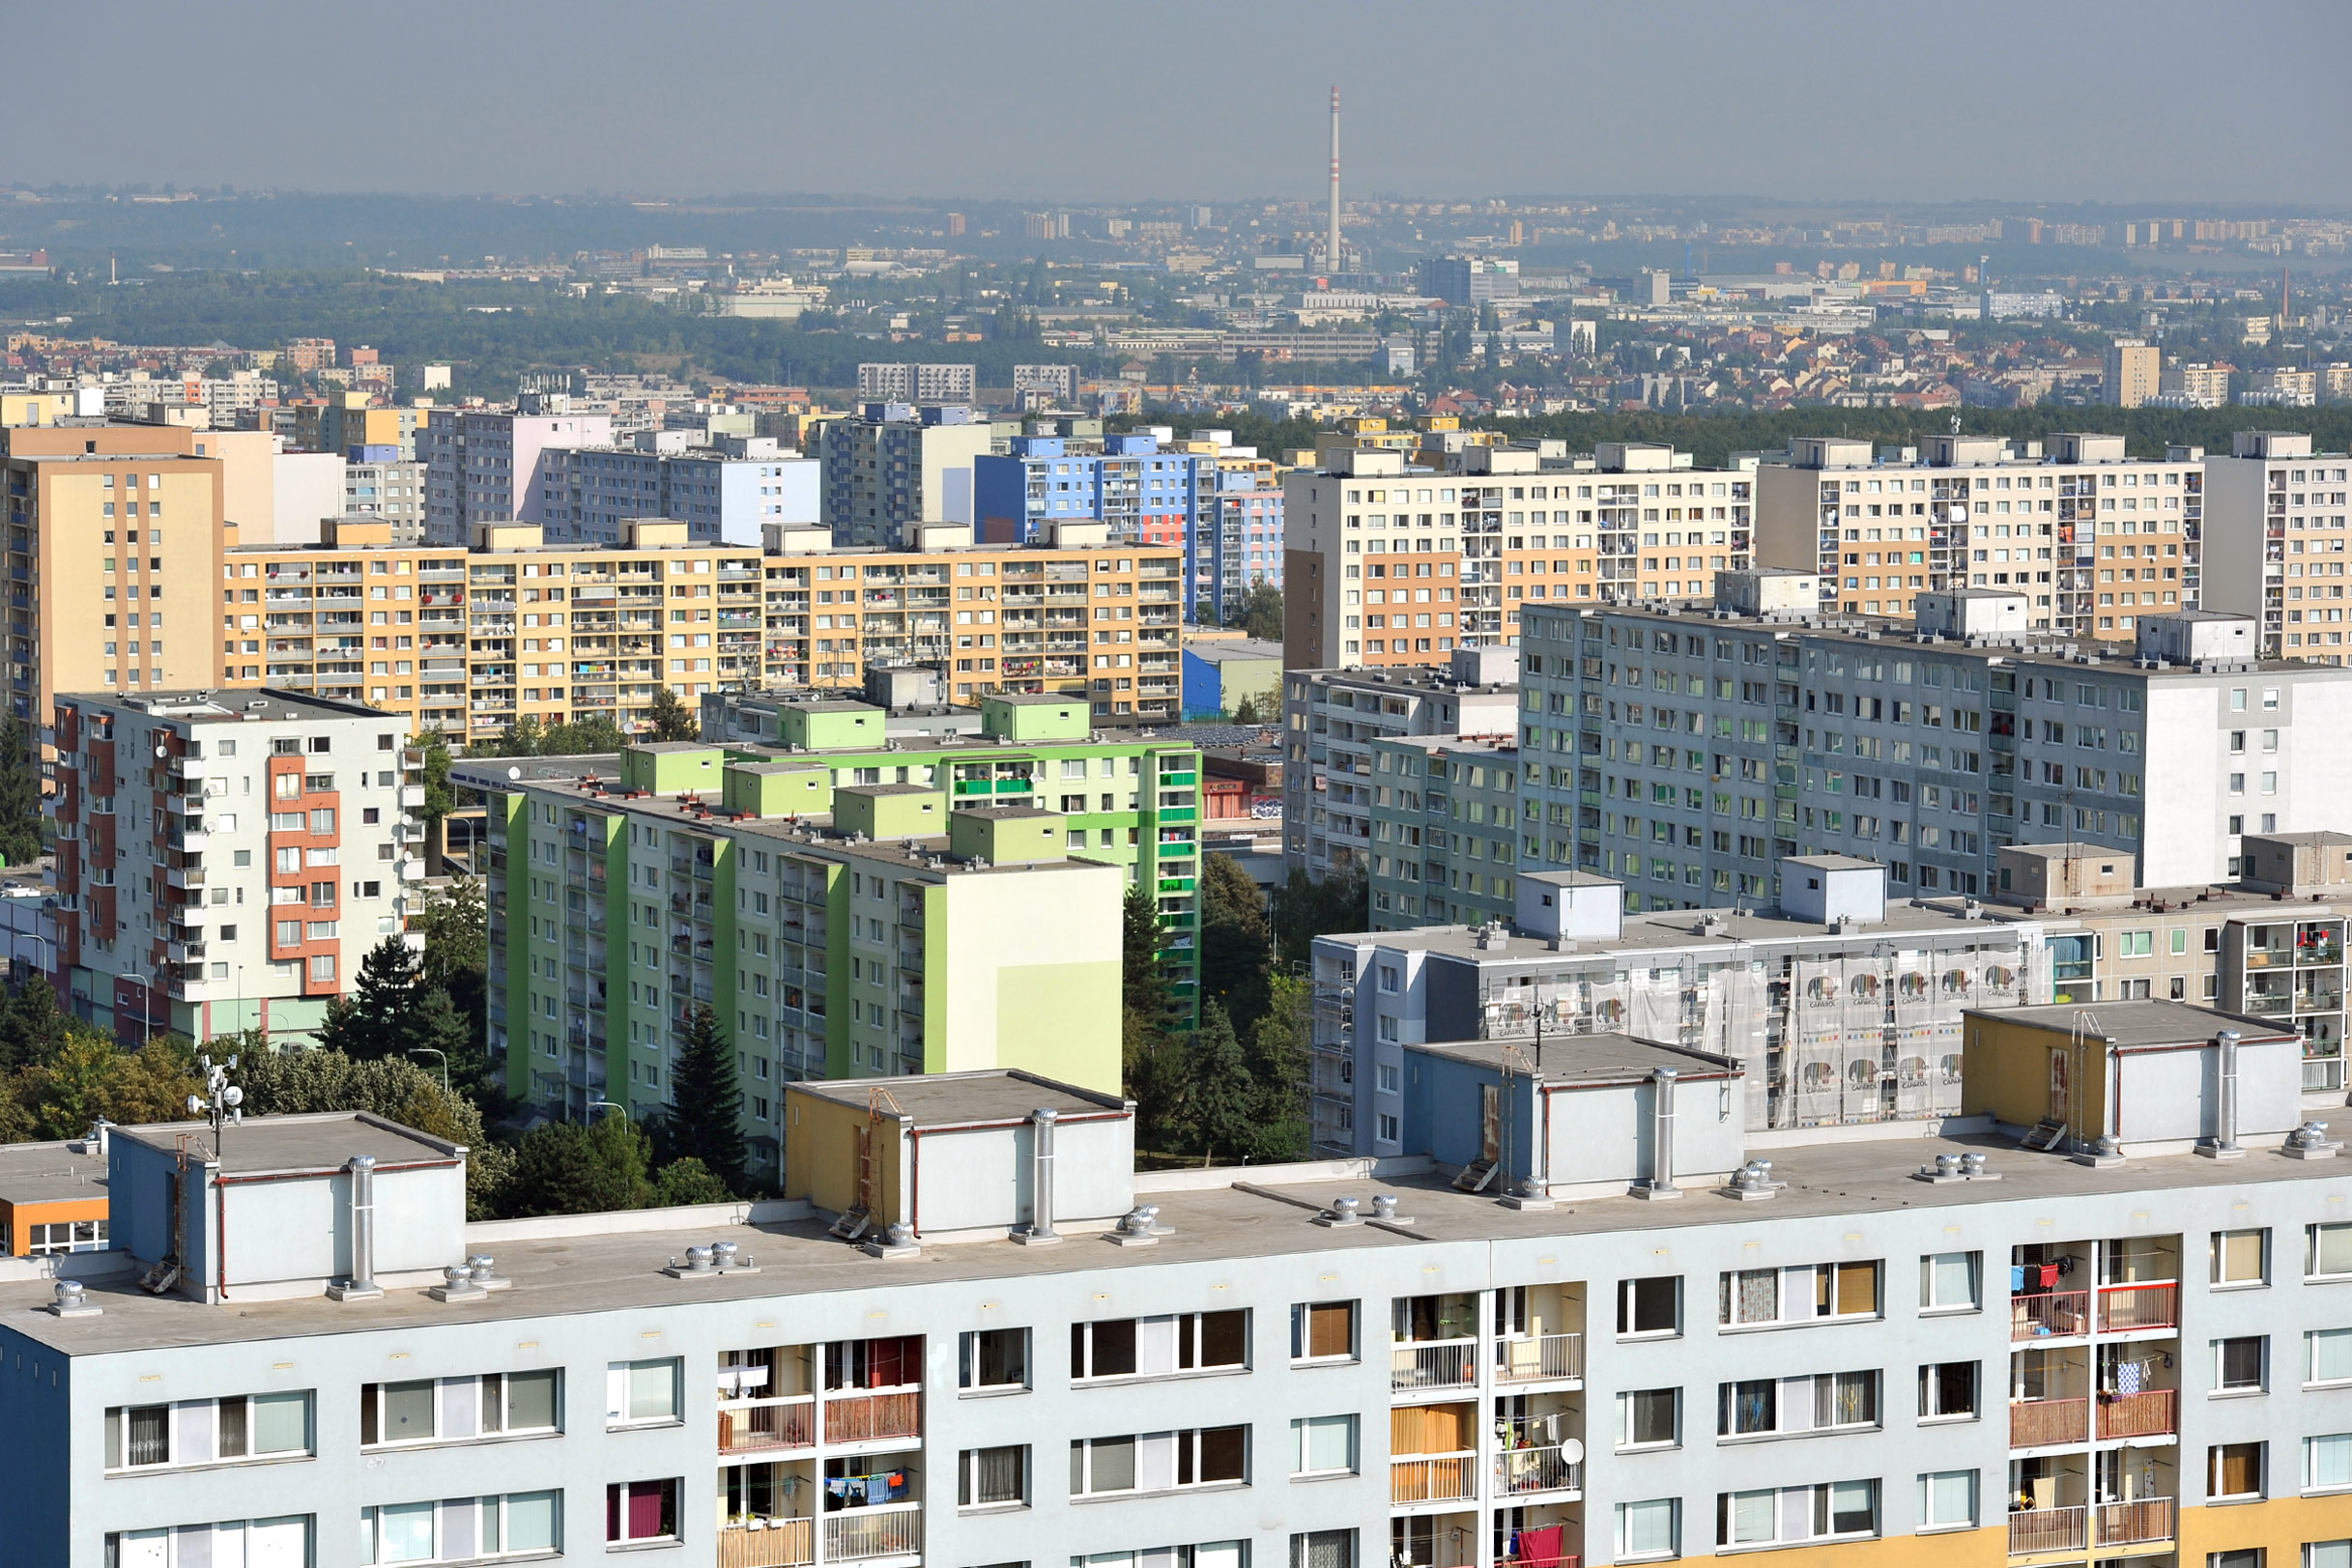
Incoherent Large-scale Homogeneous Fabric
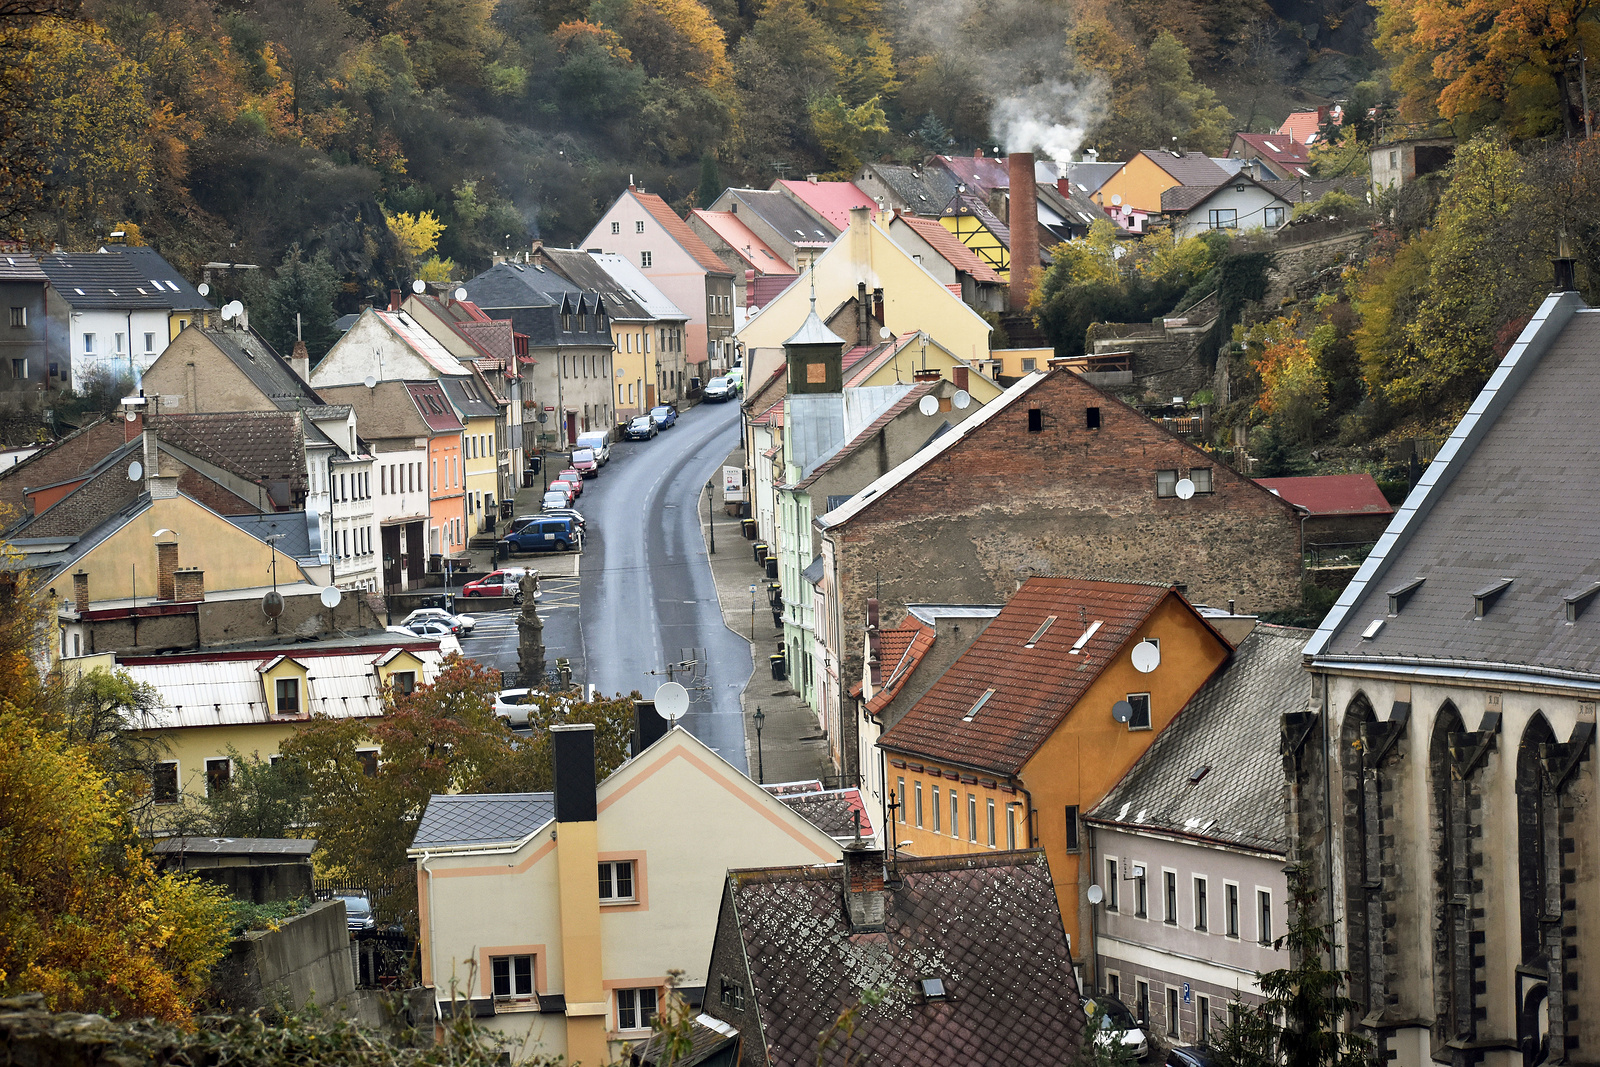
Incoherent Small-scale Linear Fabric
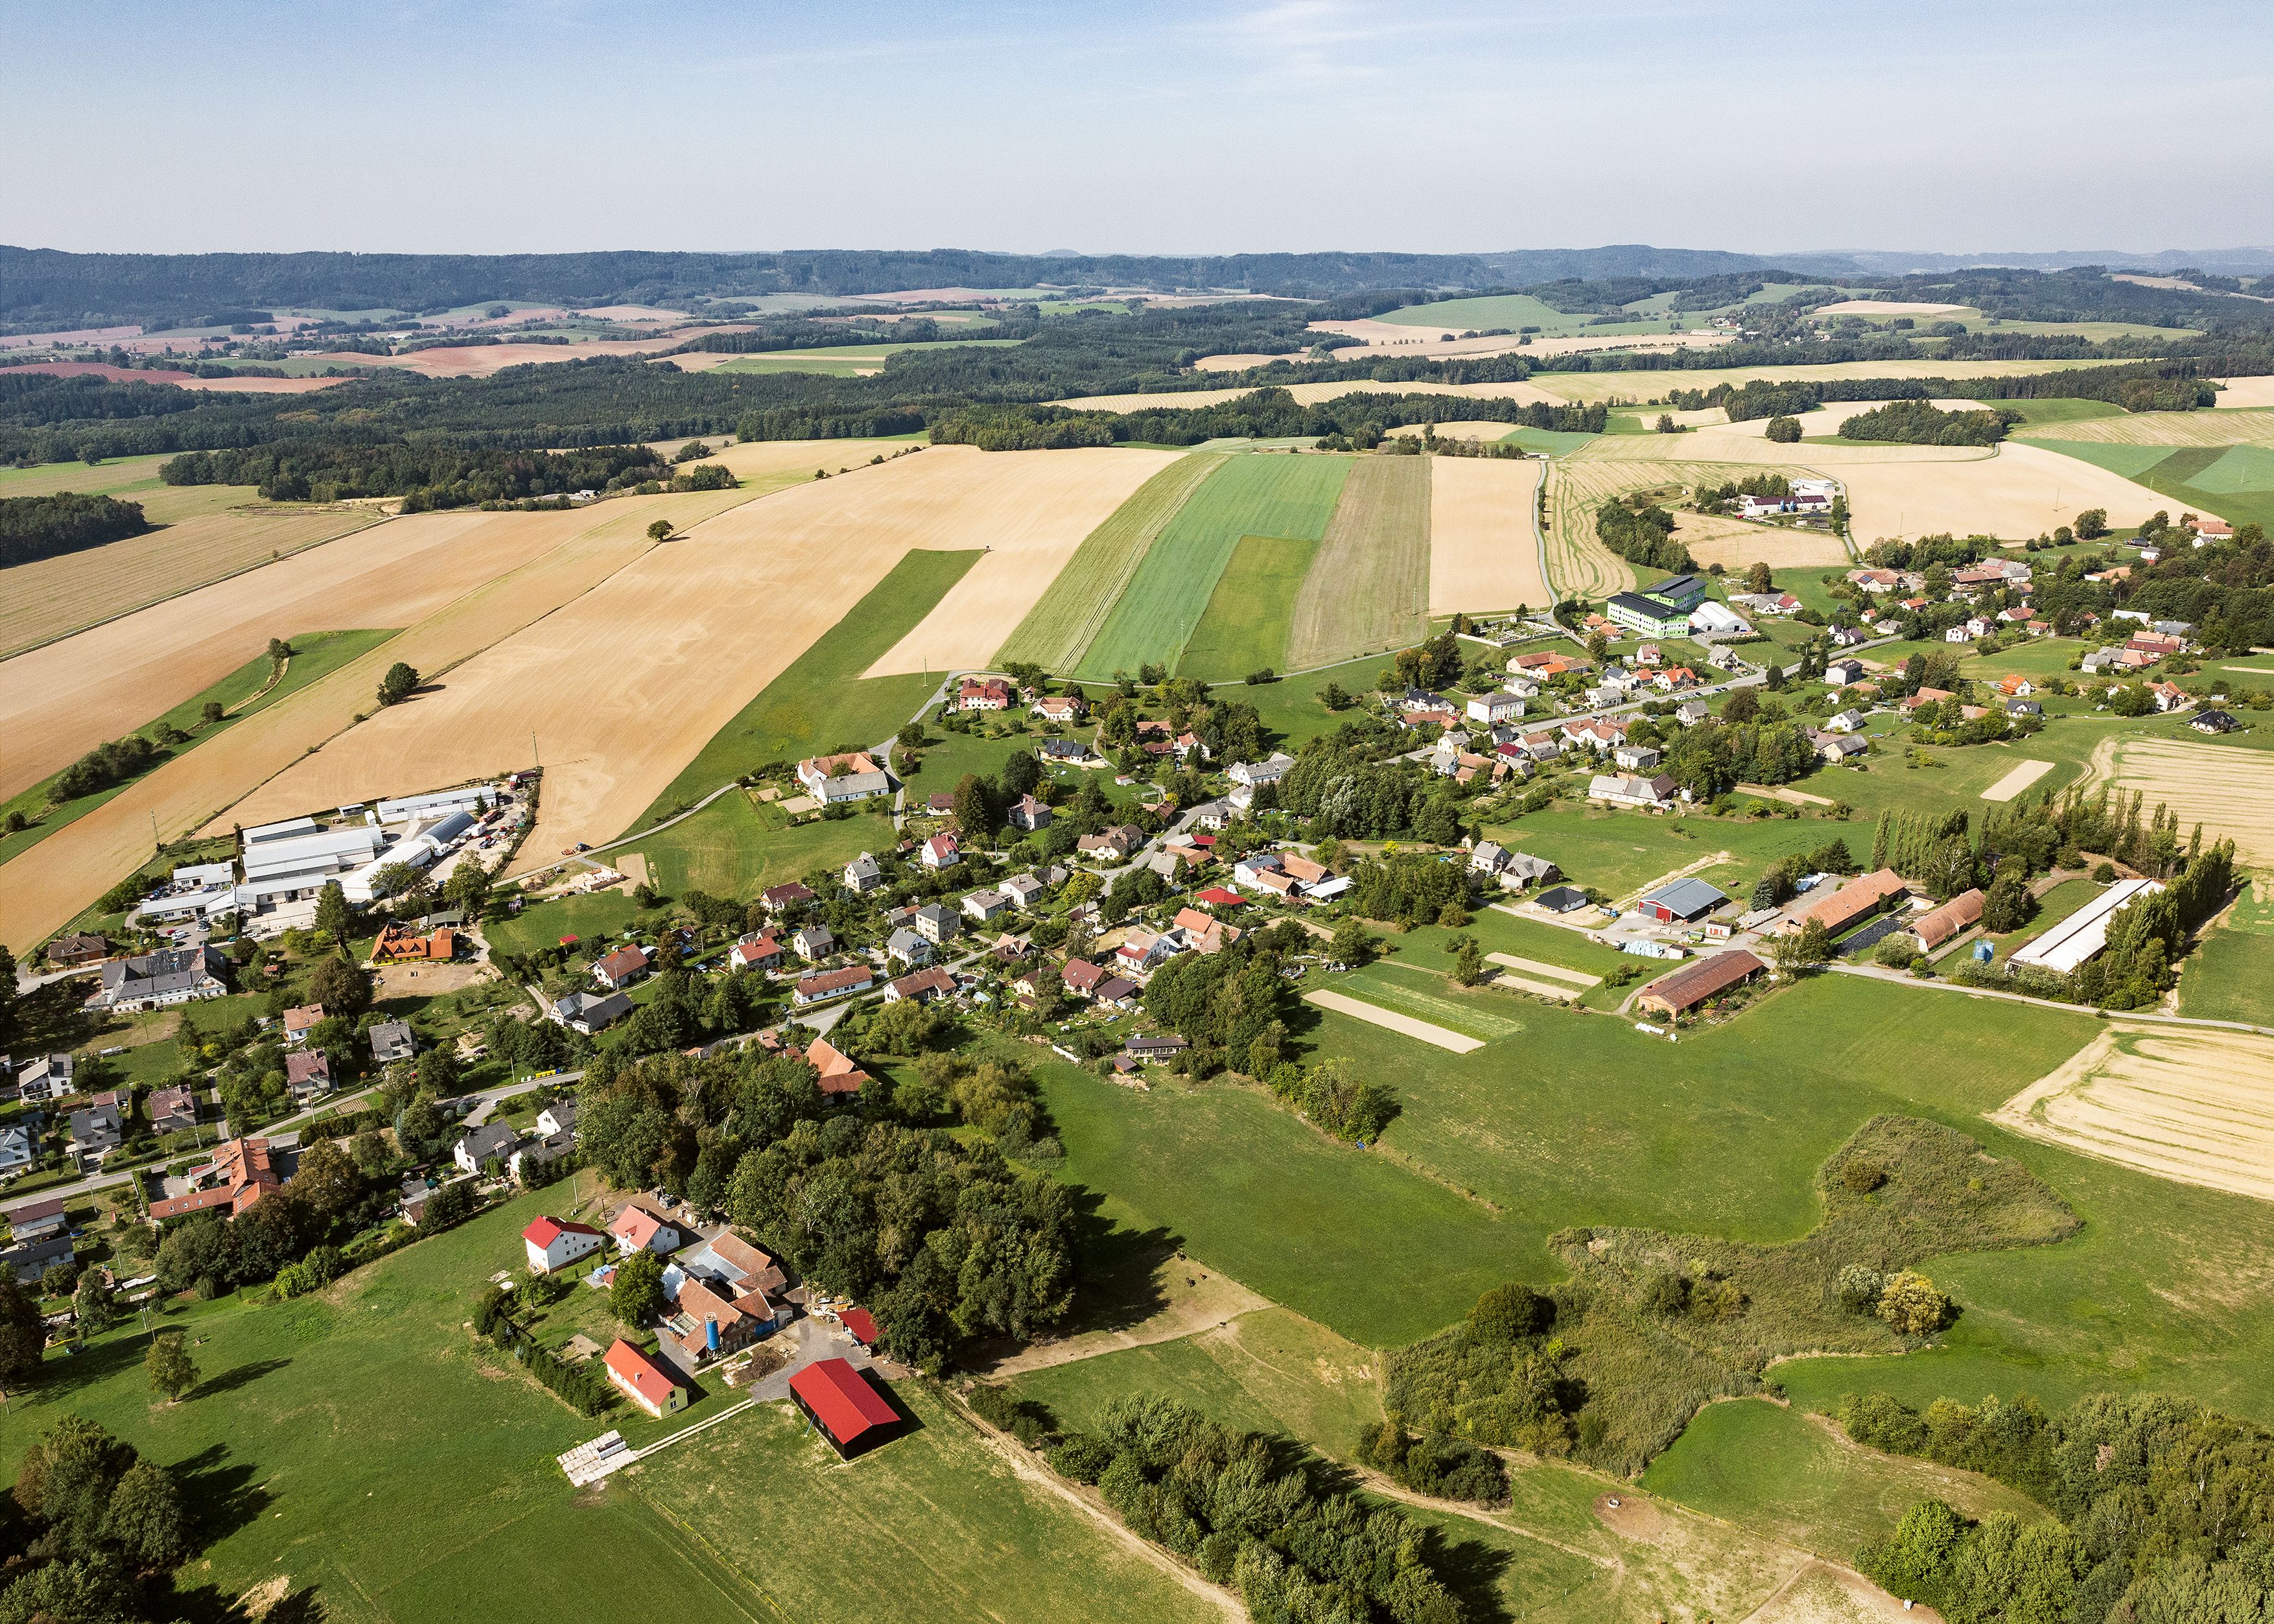
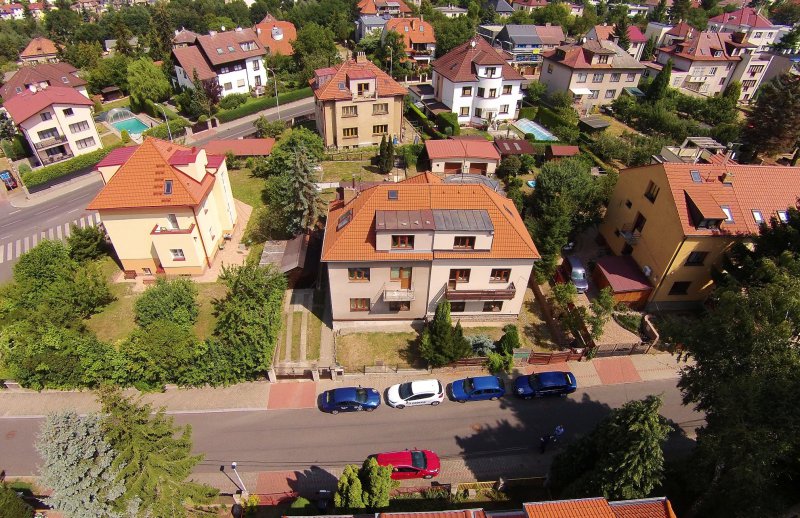
Incoherent Small-scale Sparse Fabric
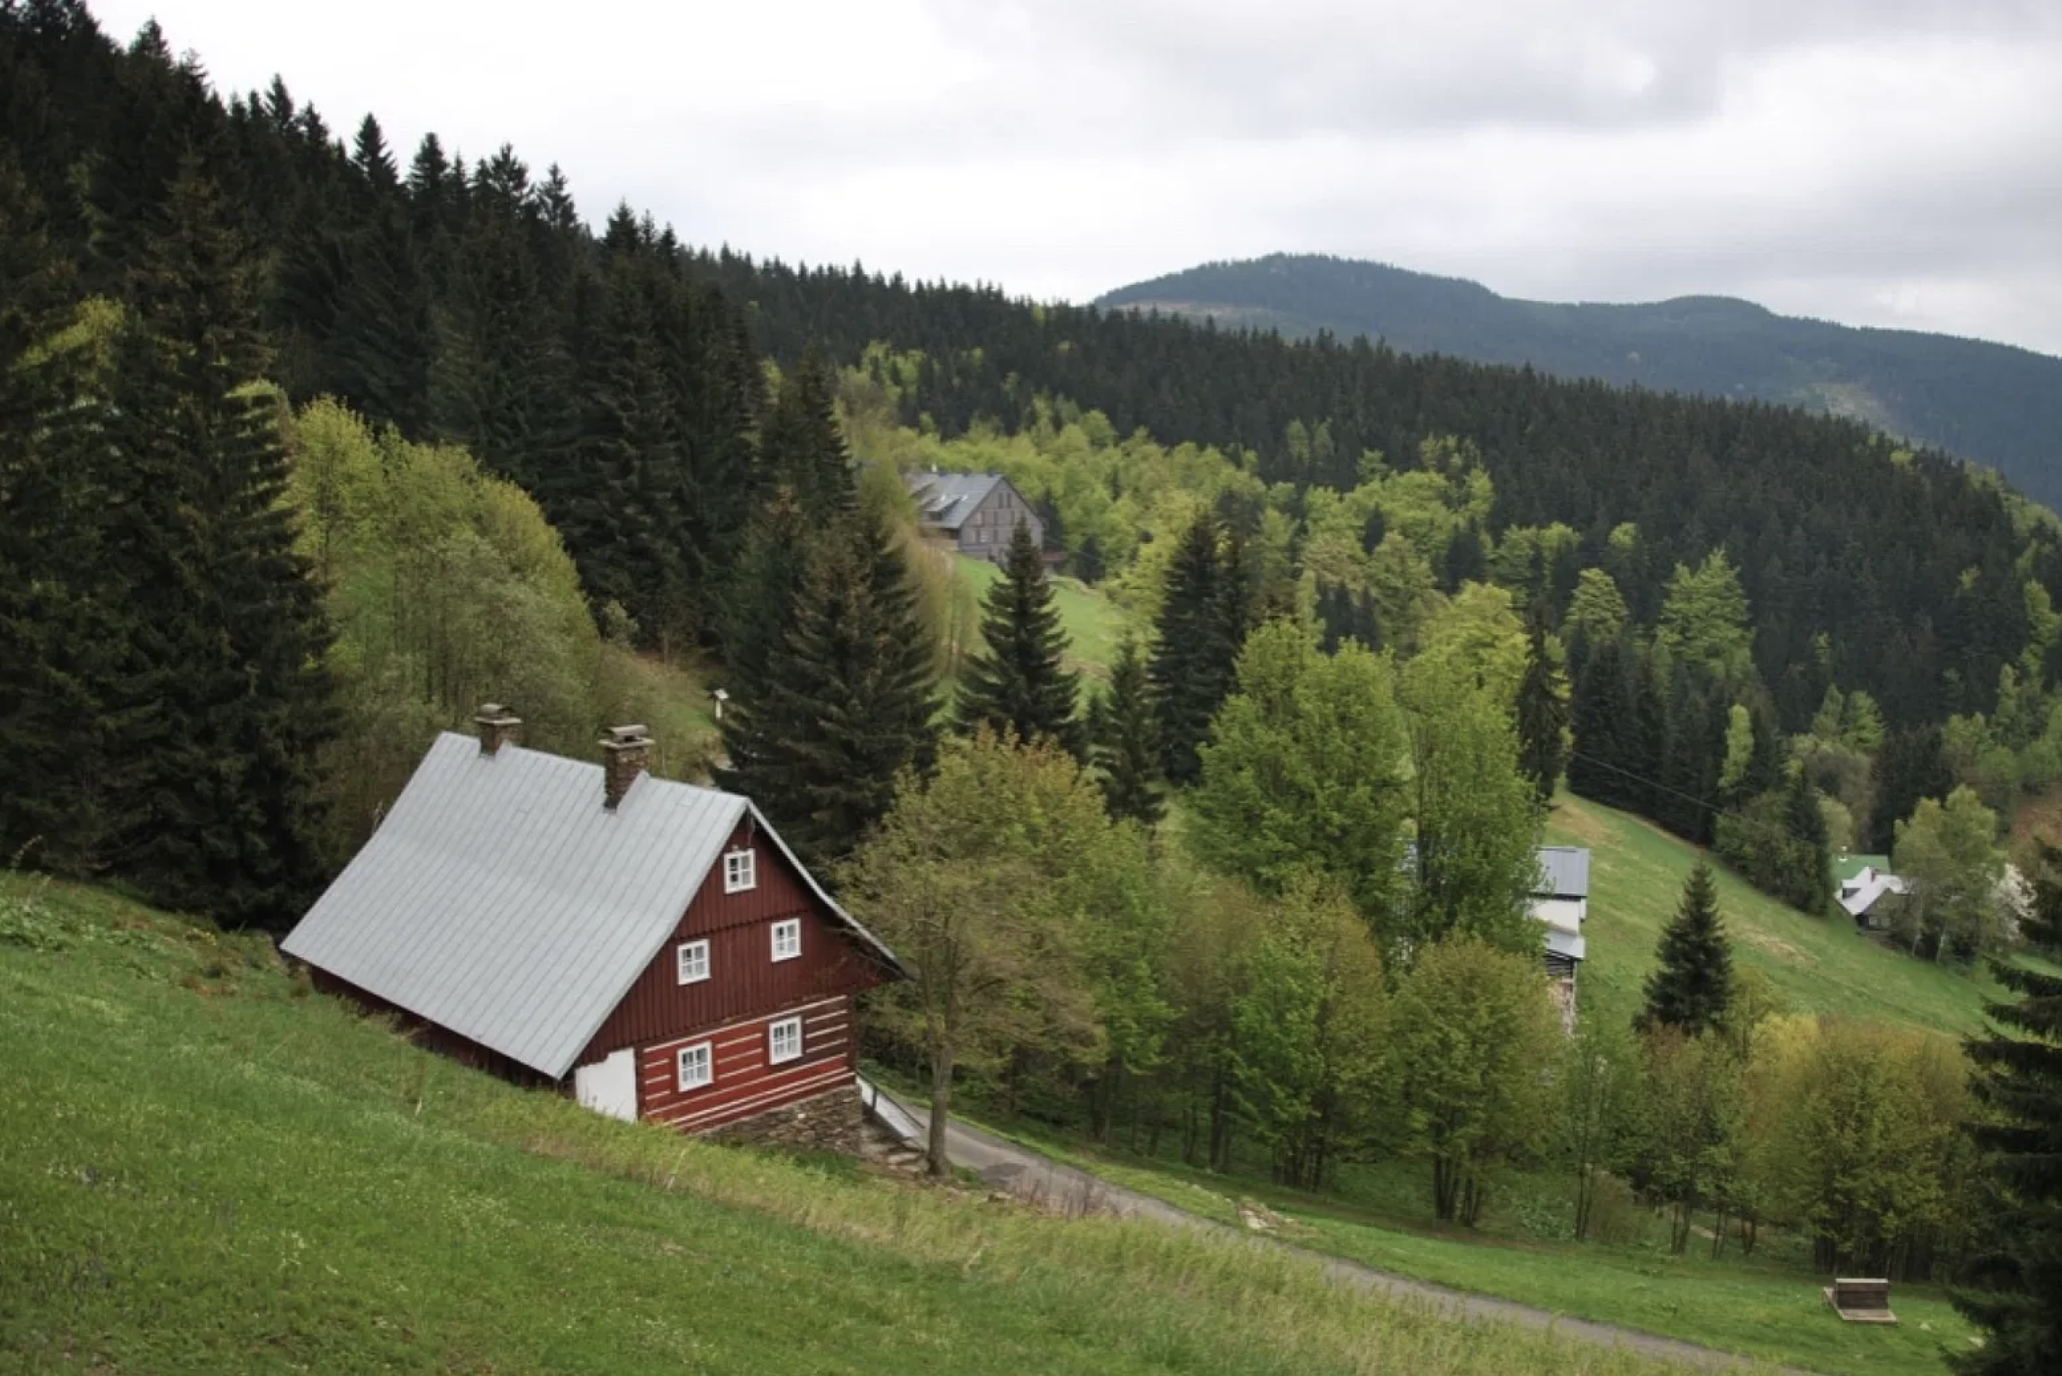
Incoherent Small-scale Compact Fabric
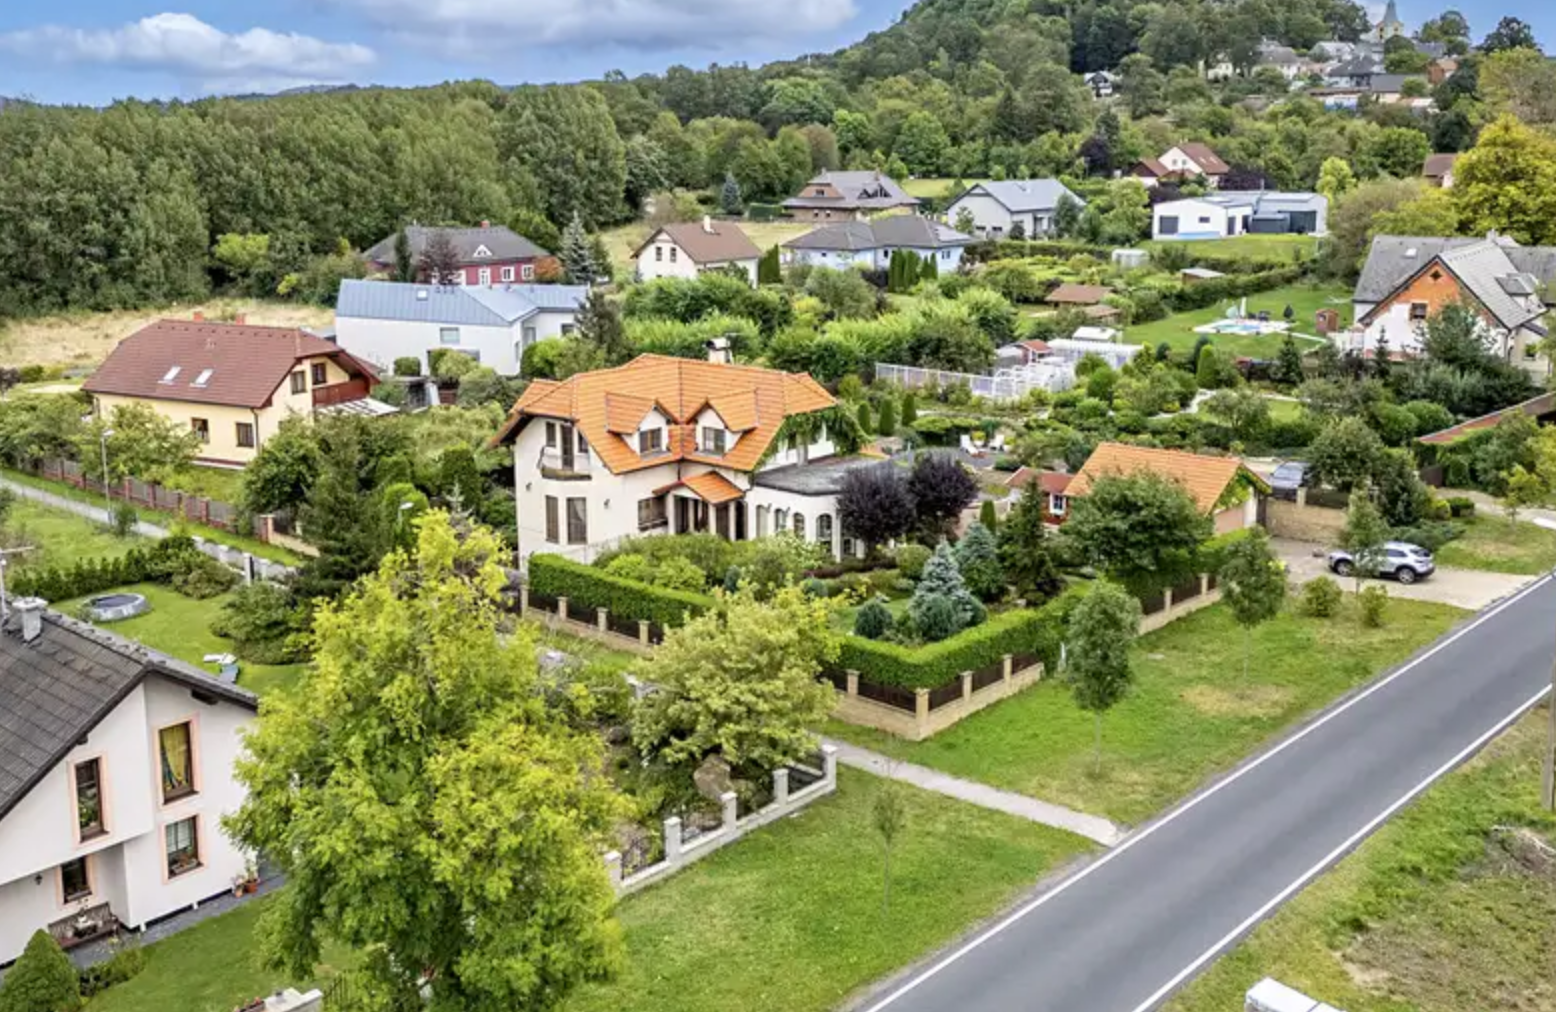
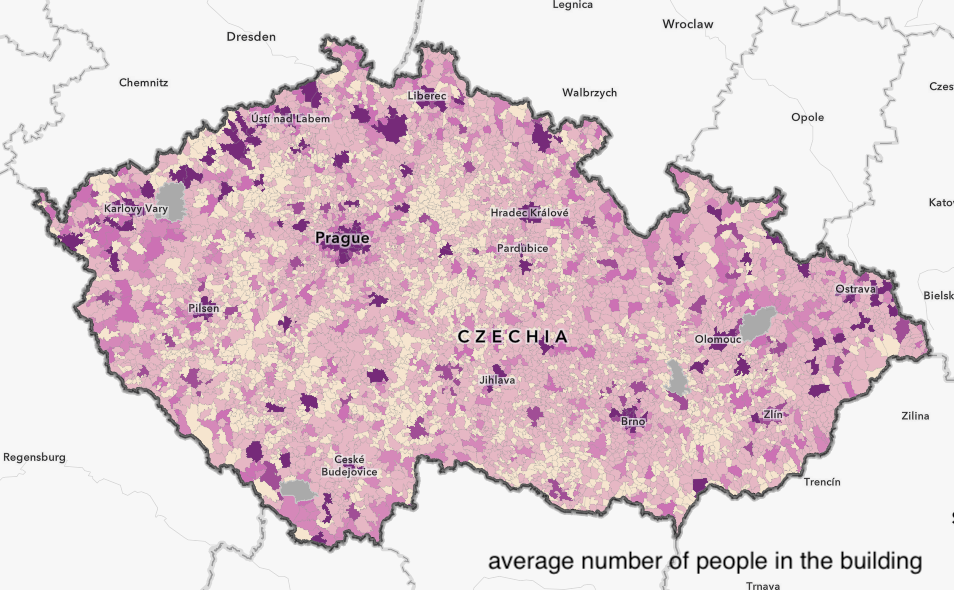
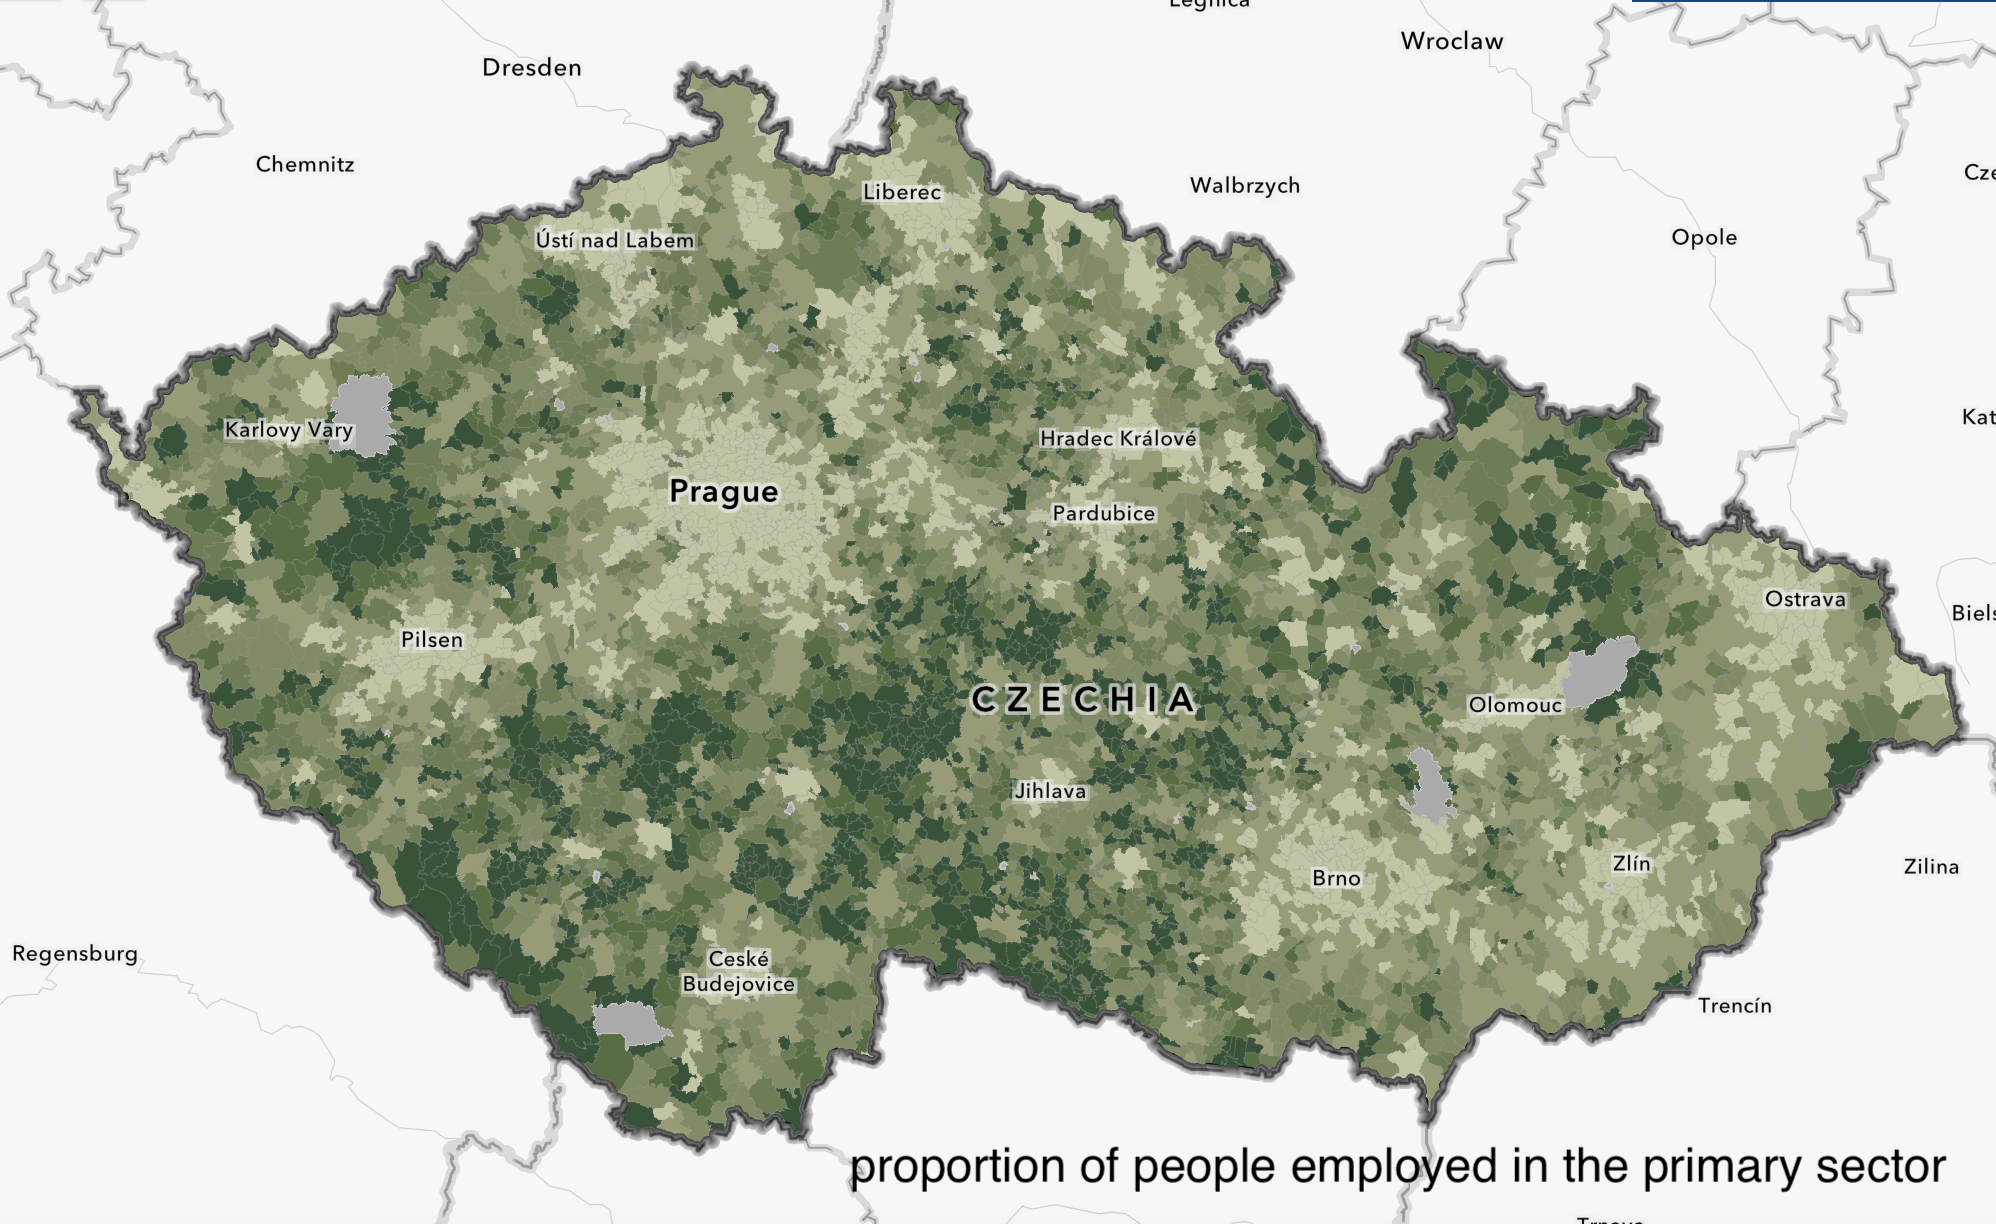
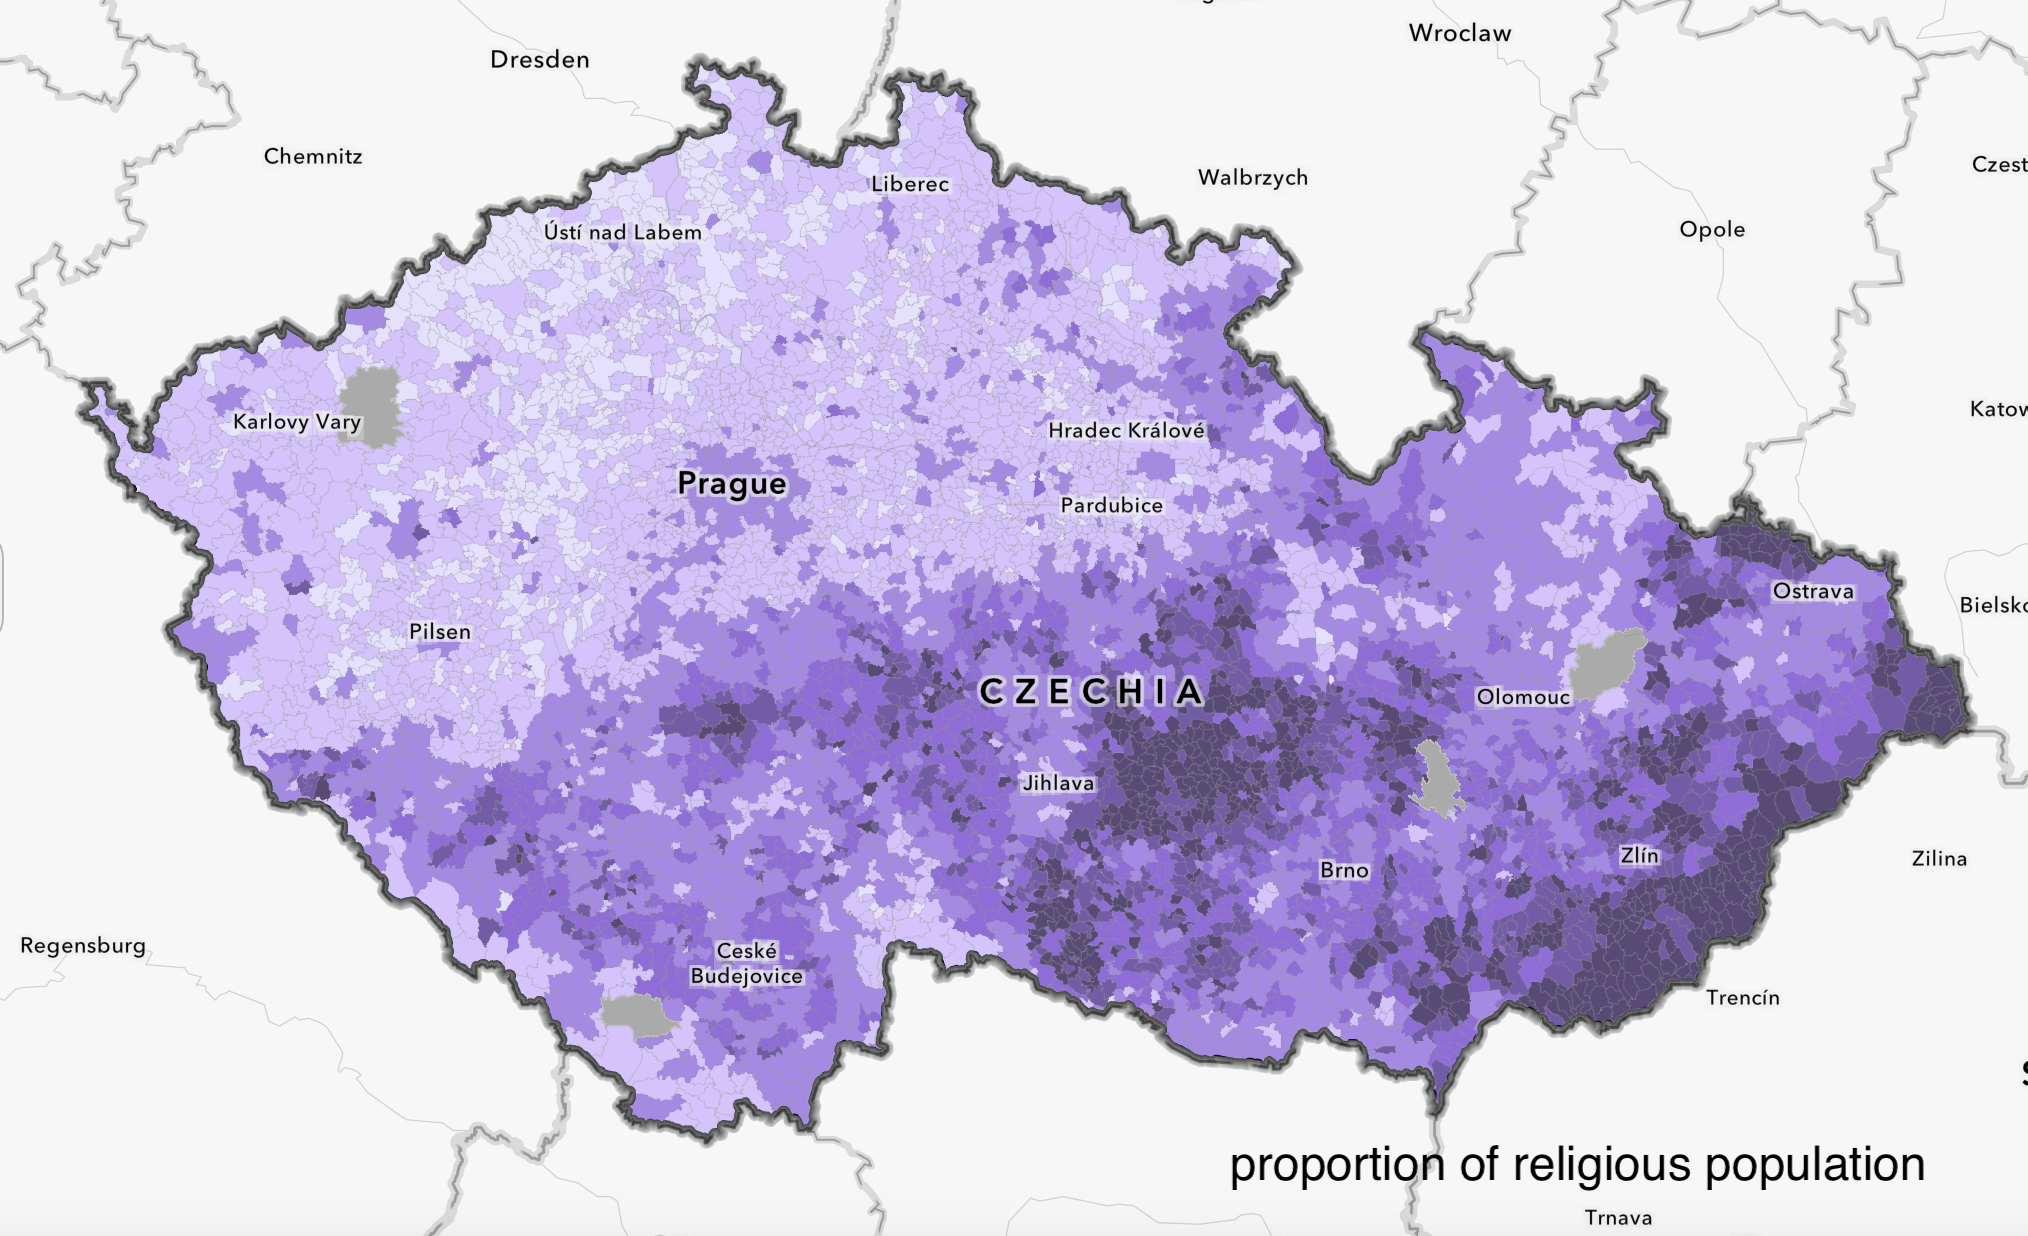
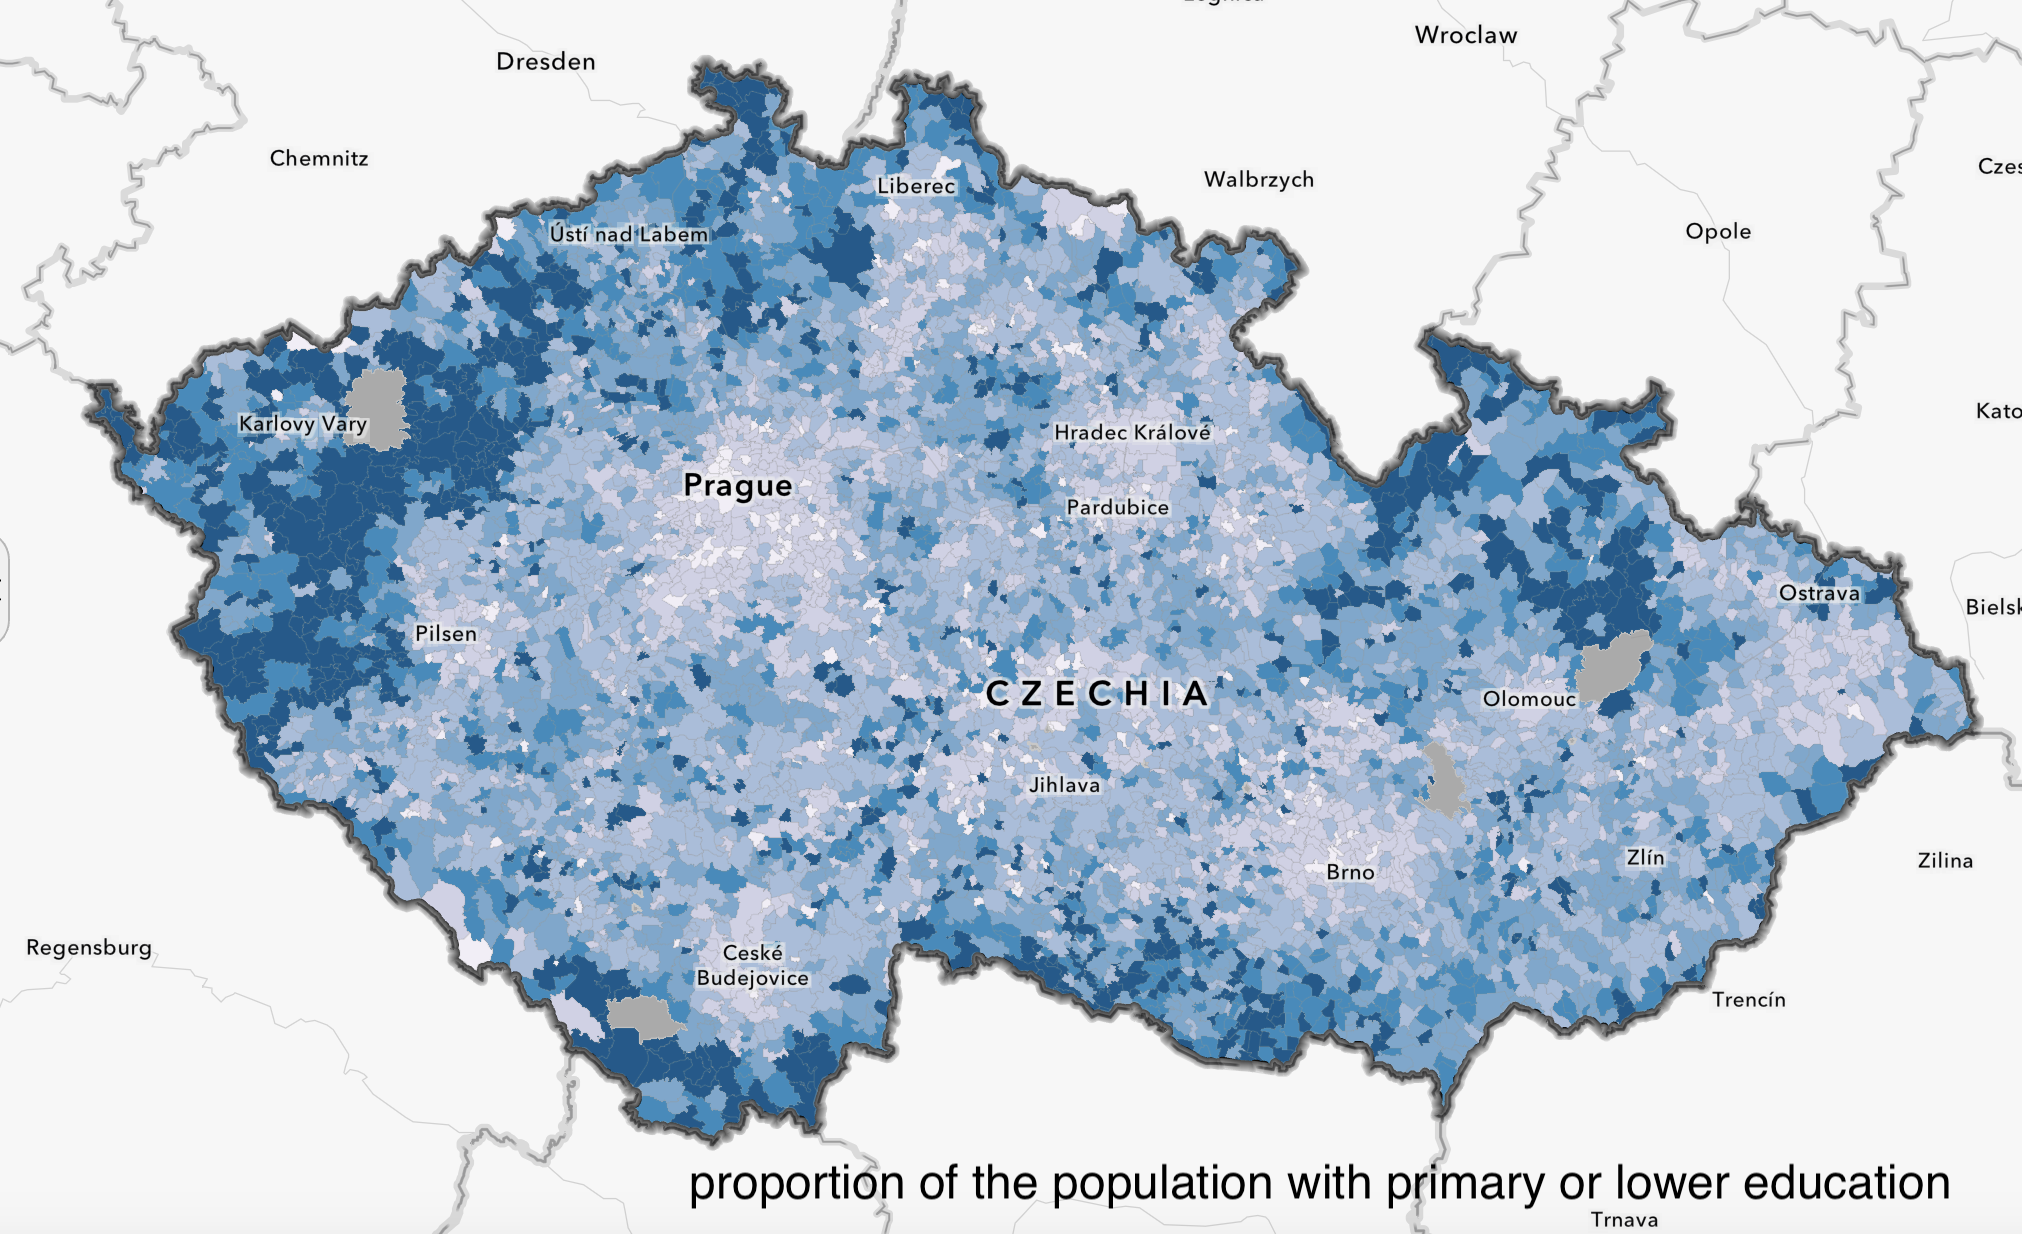
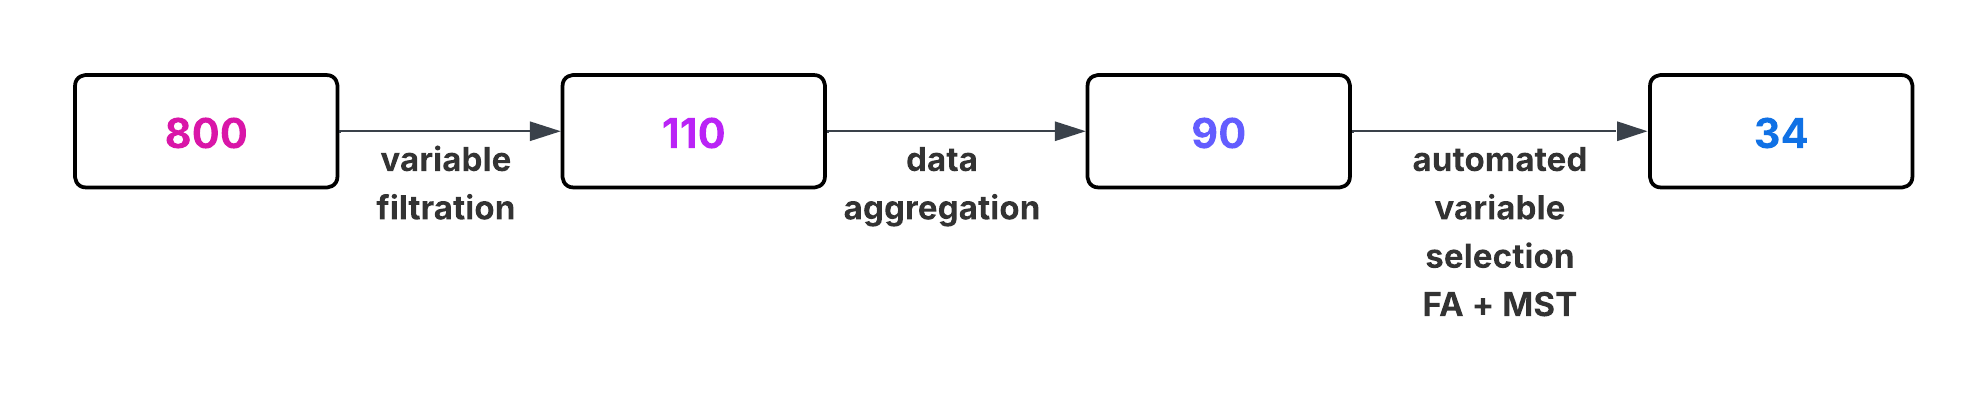
Census processing
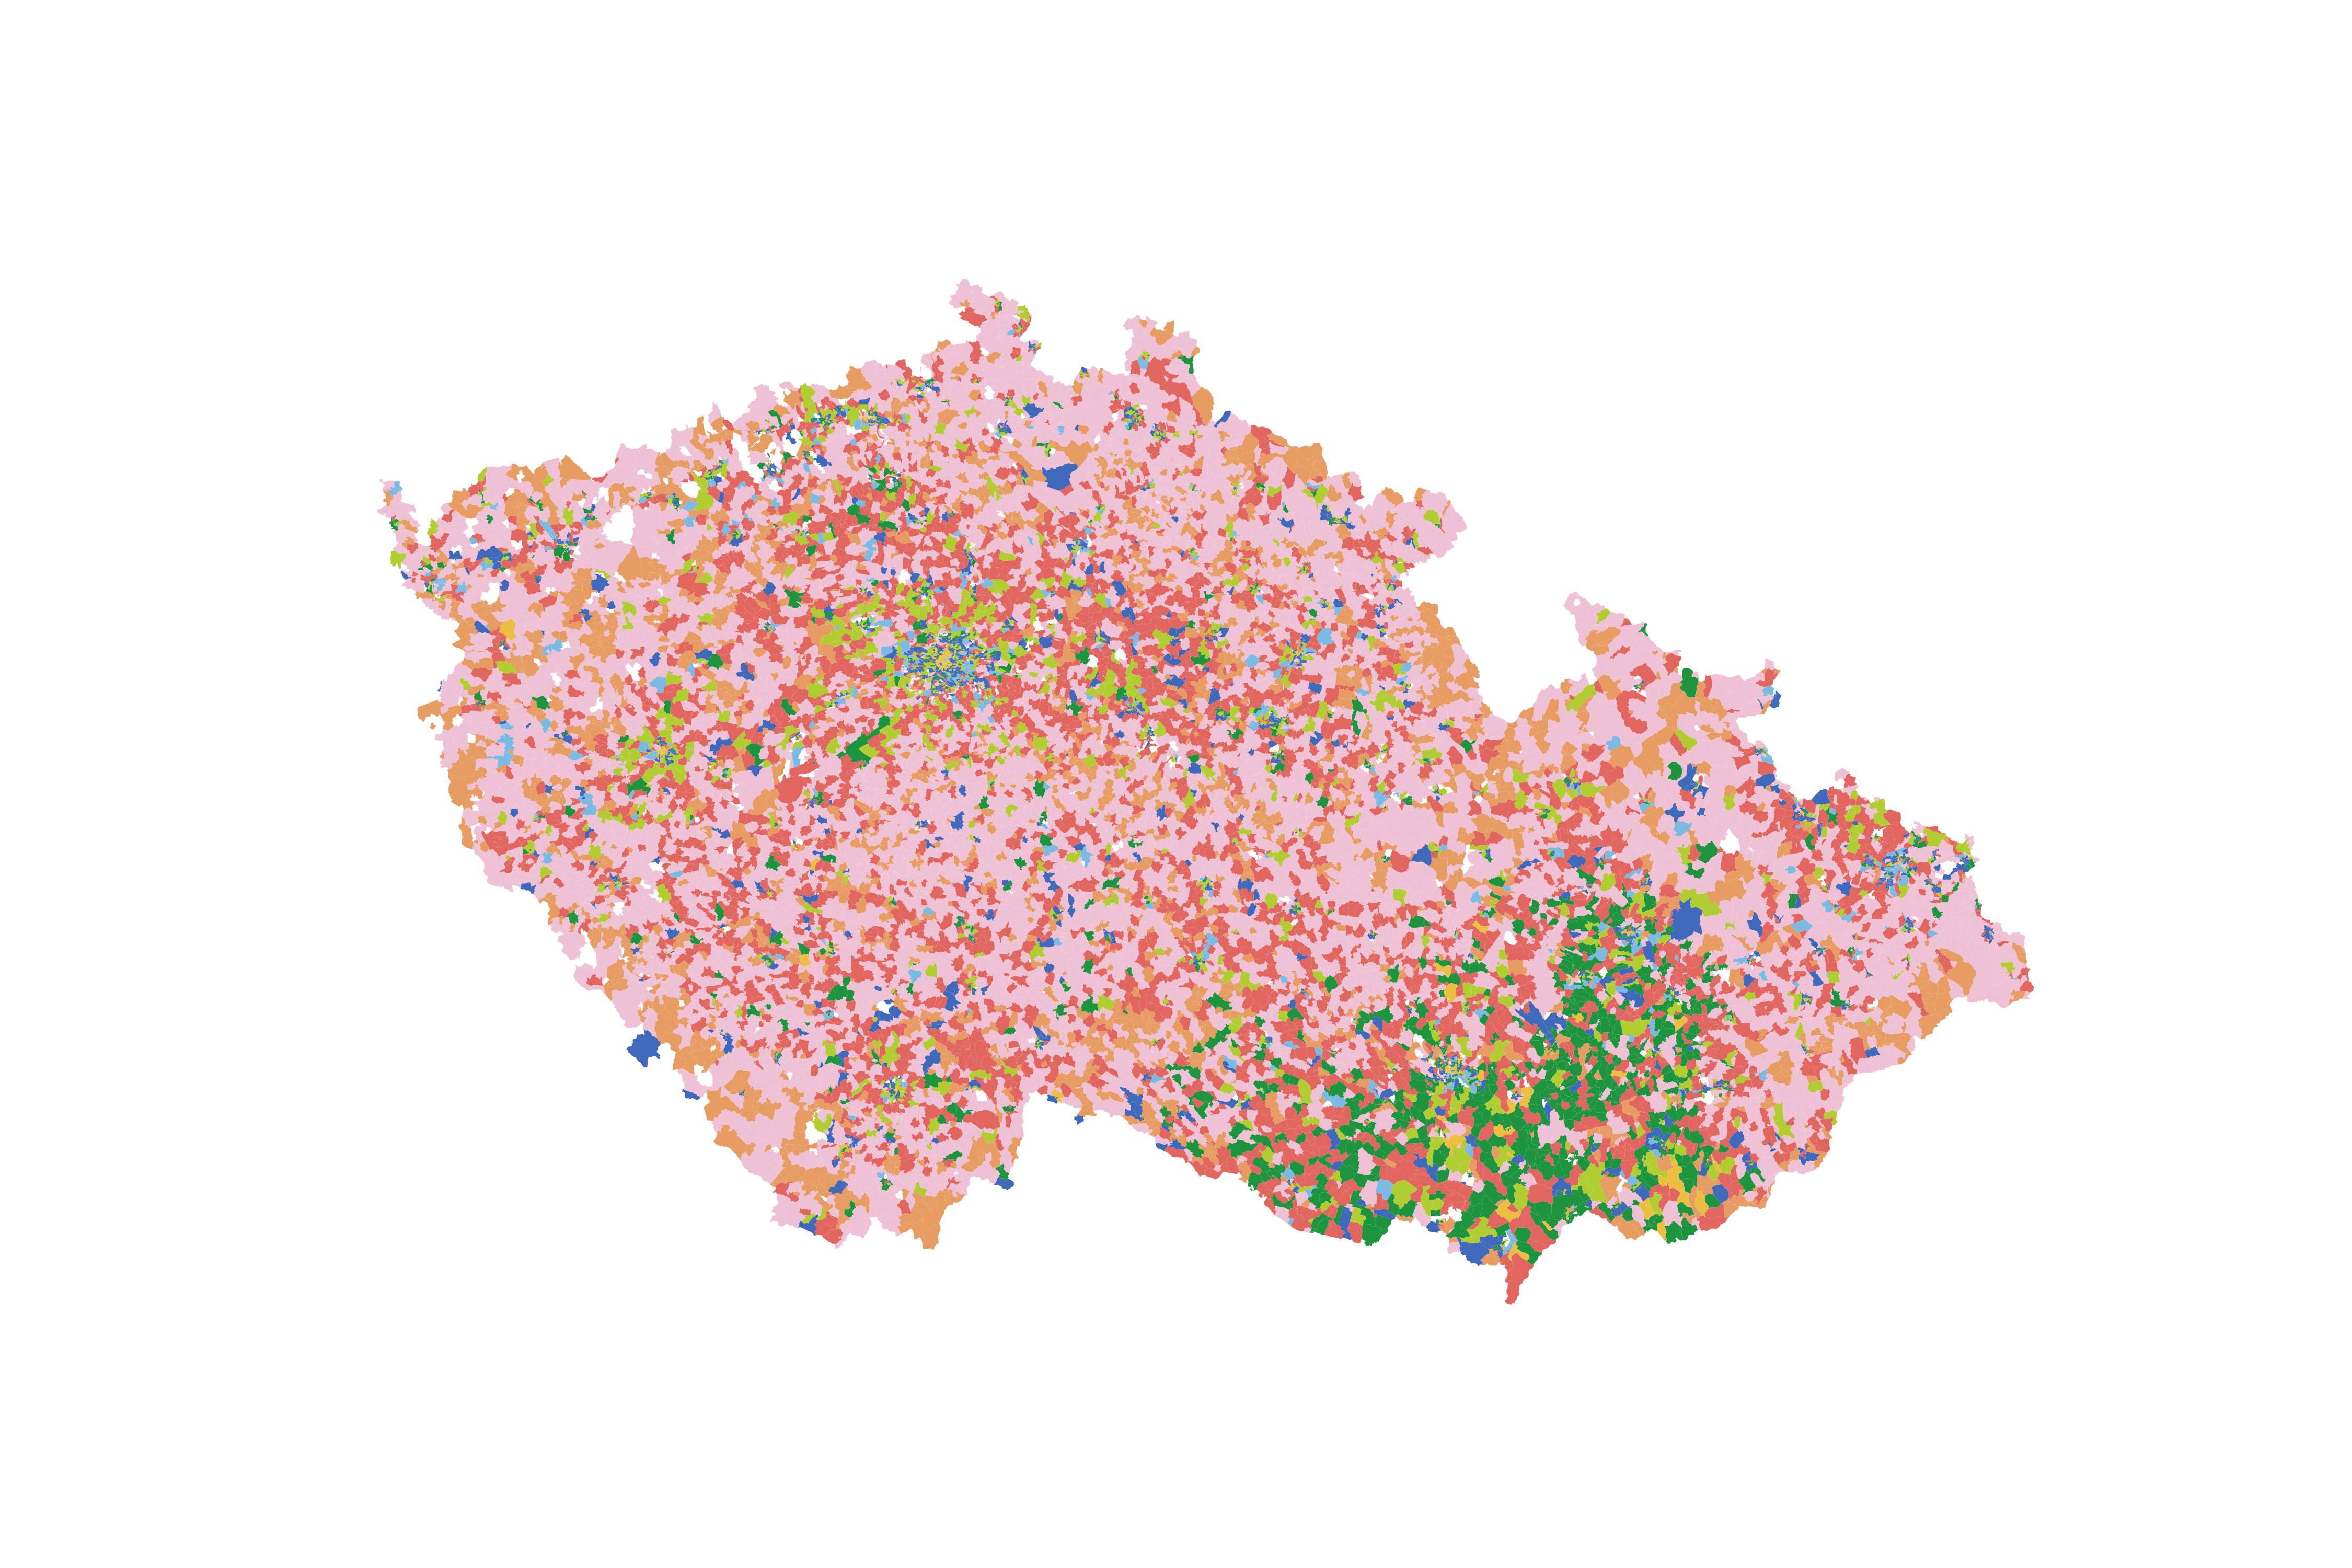
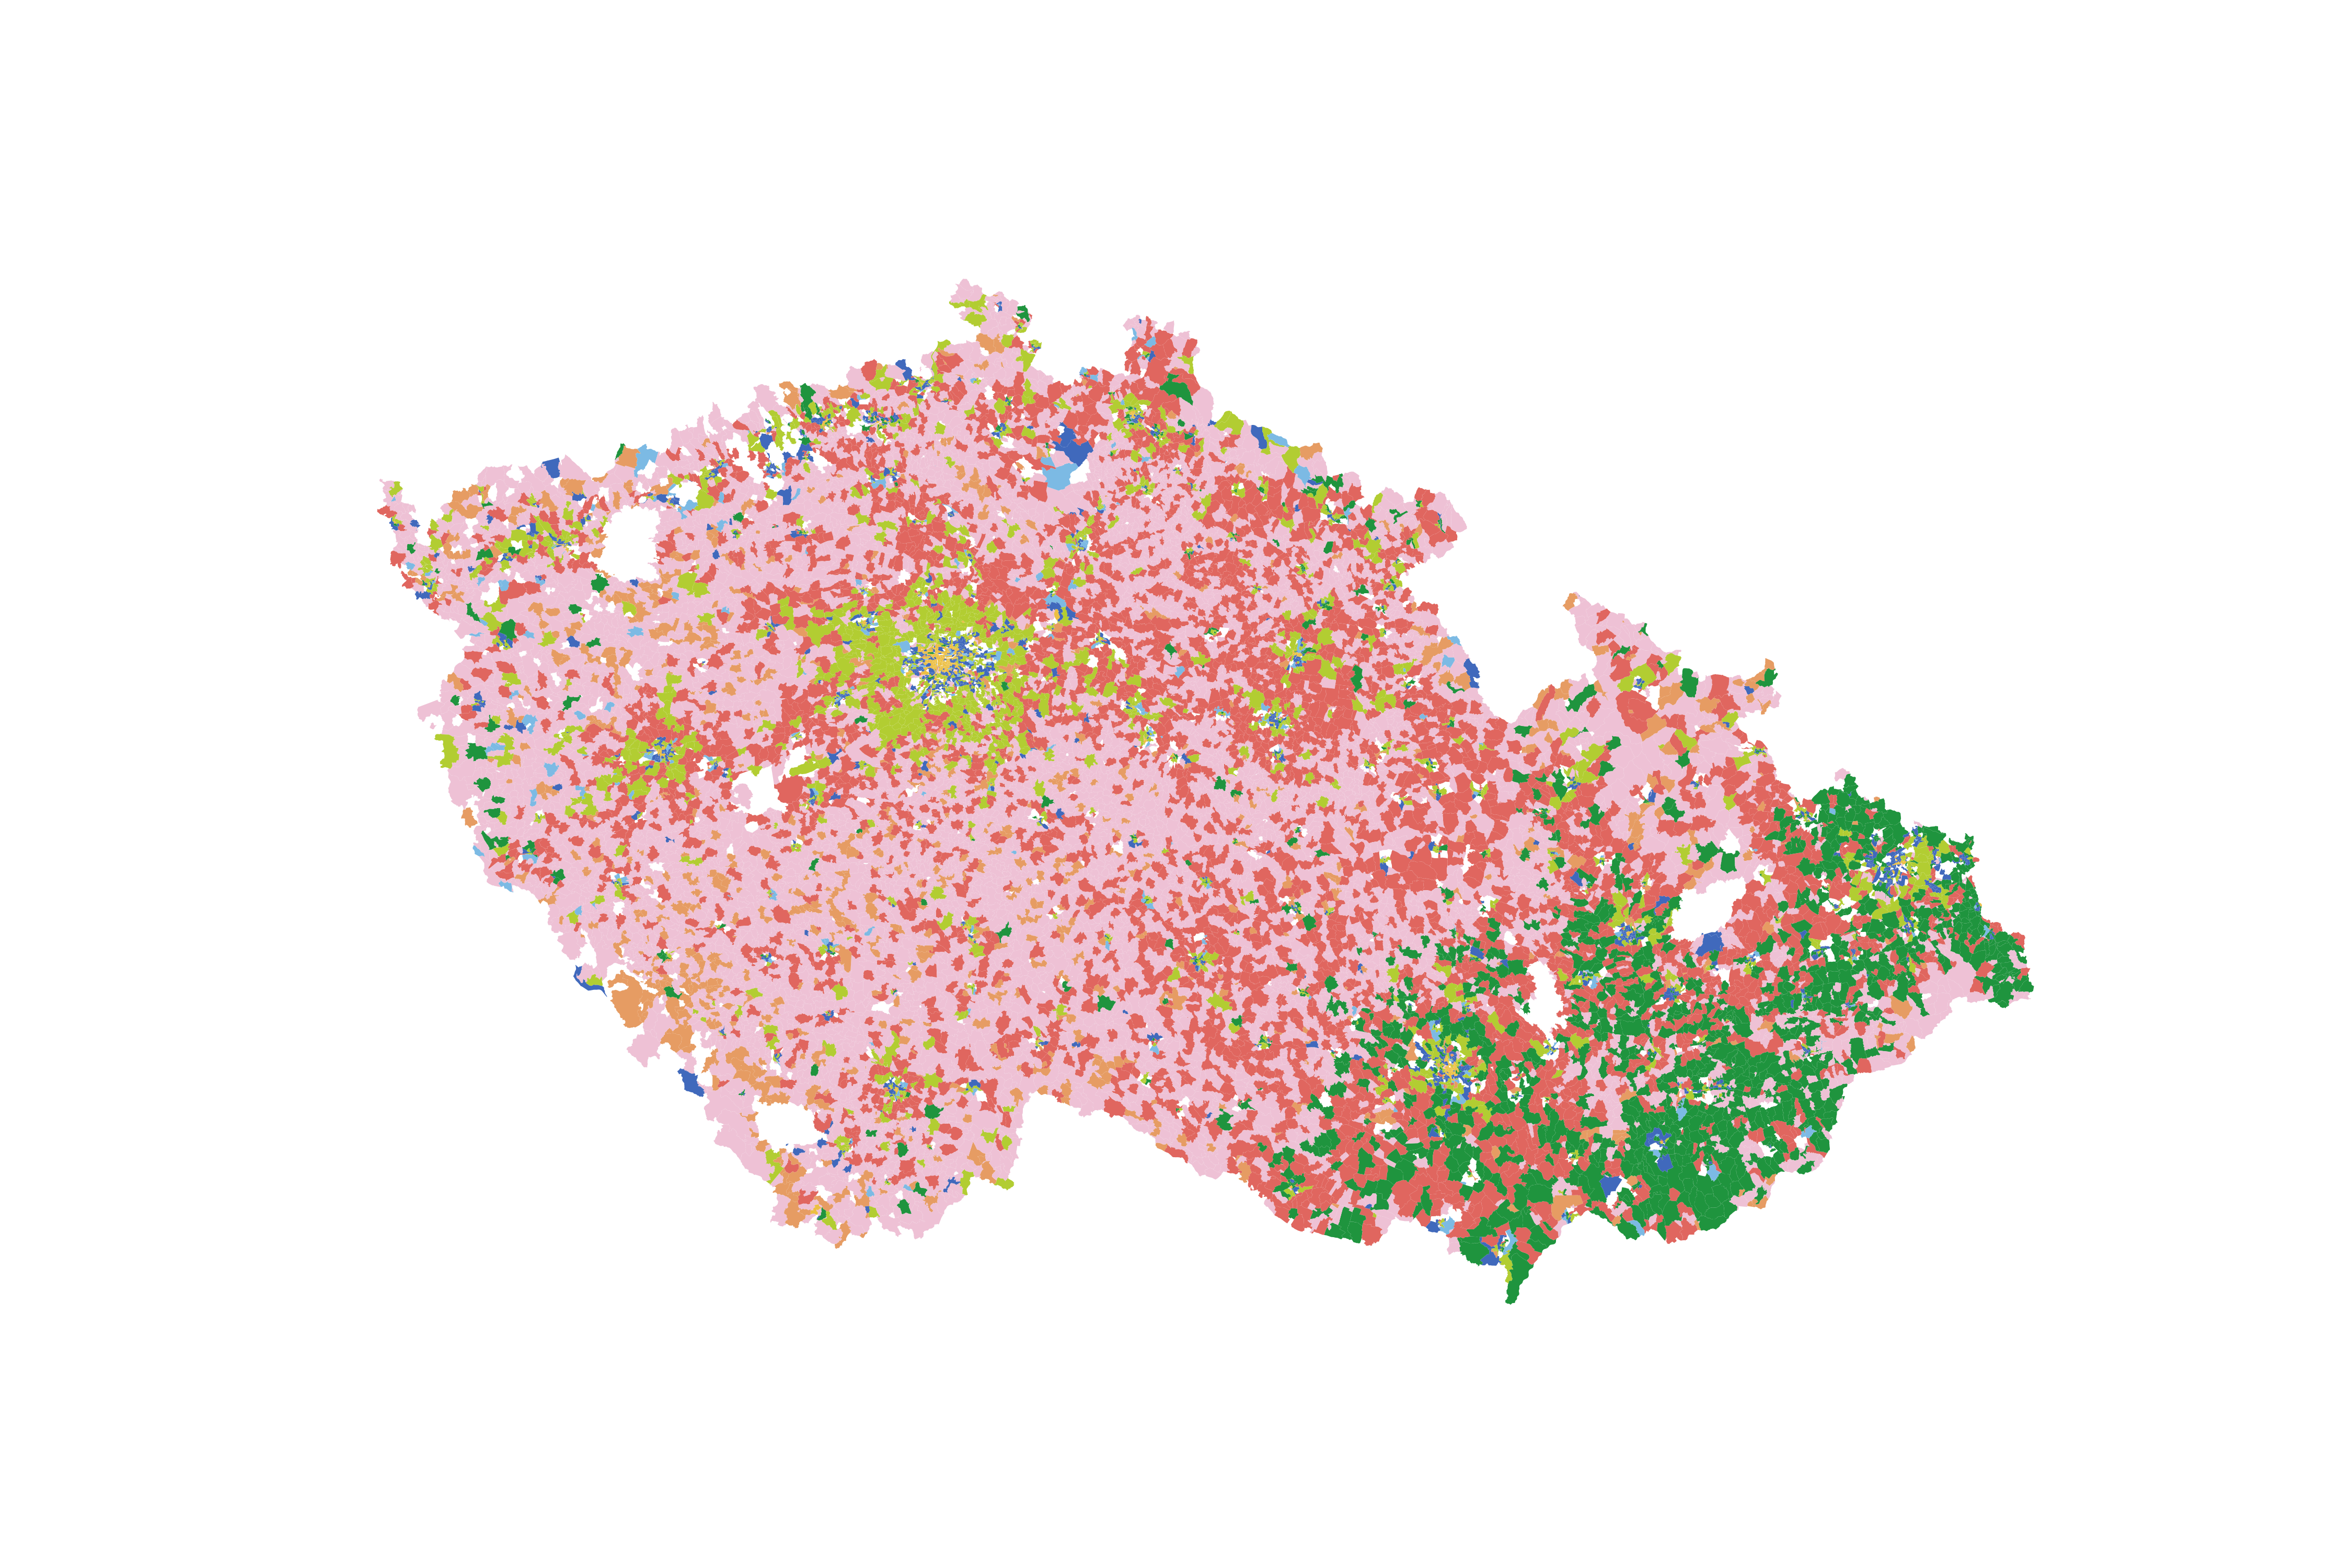
Built form types
Prediction
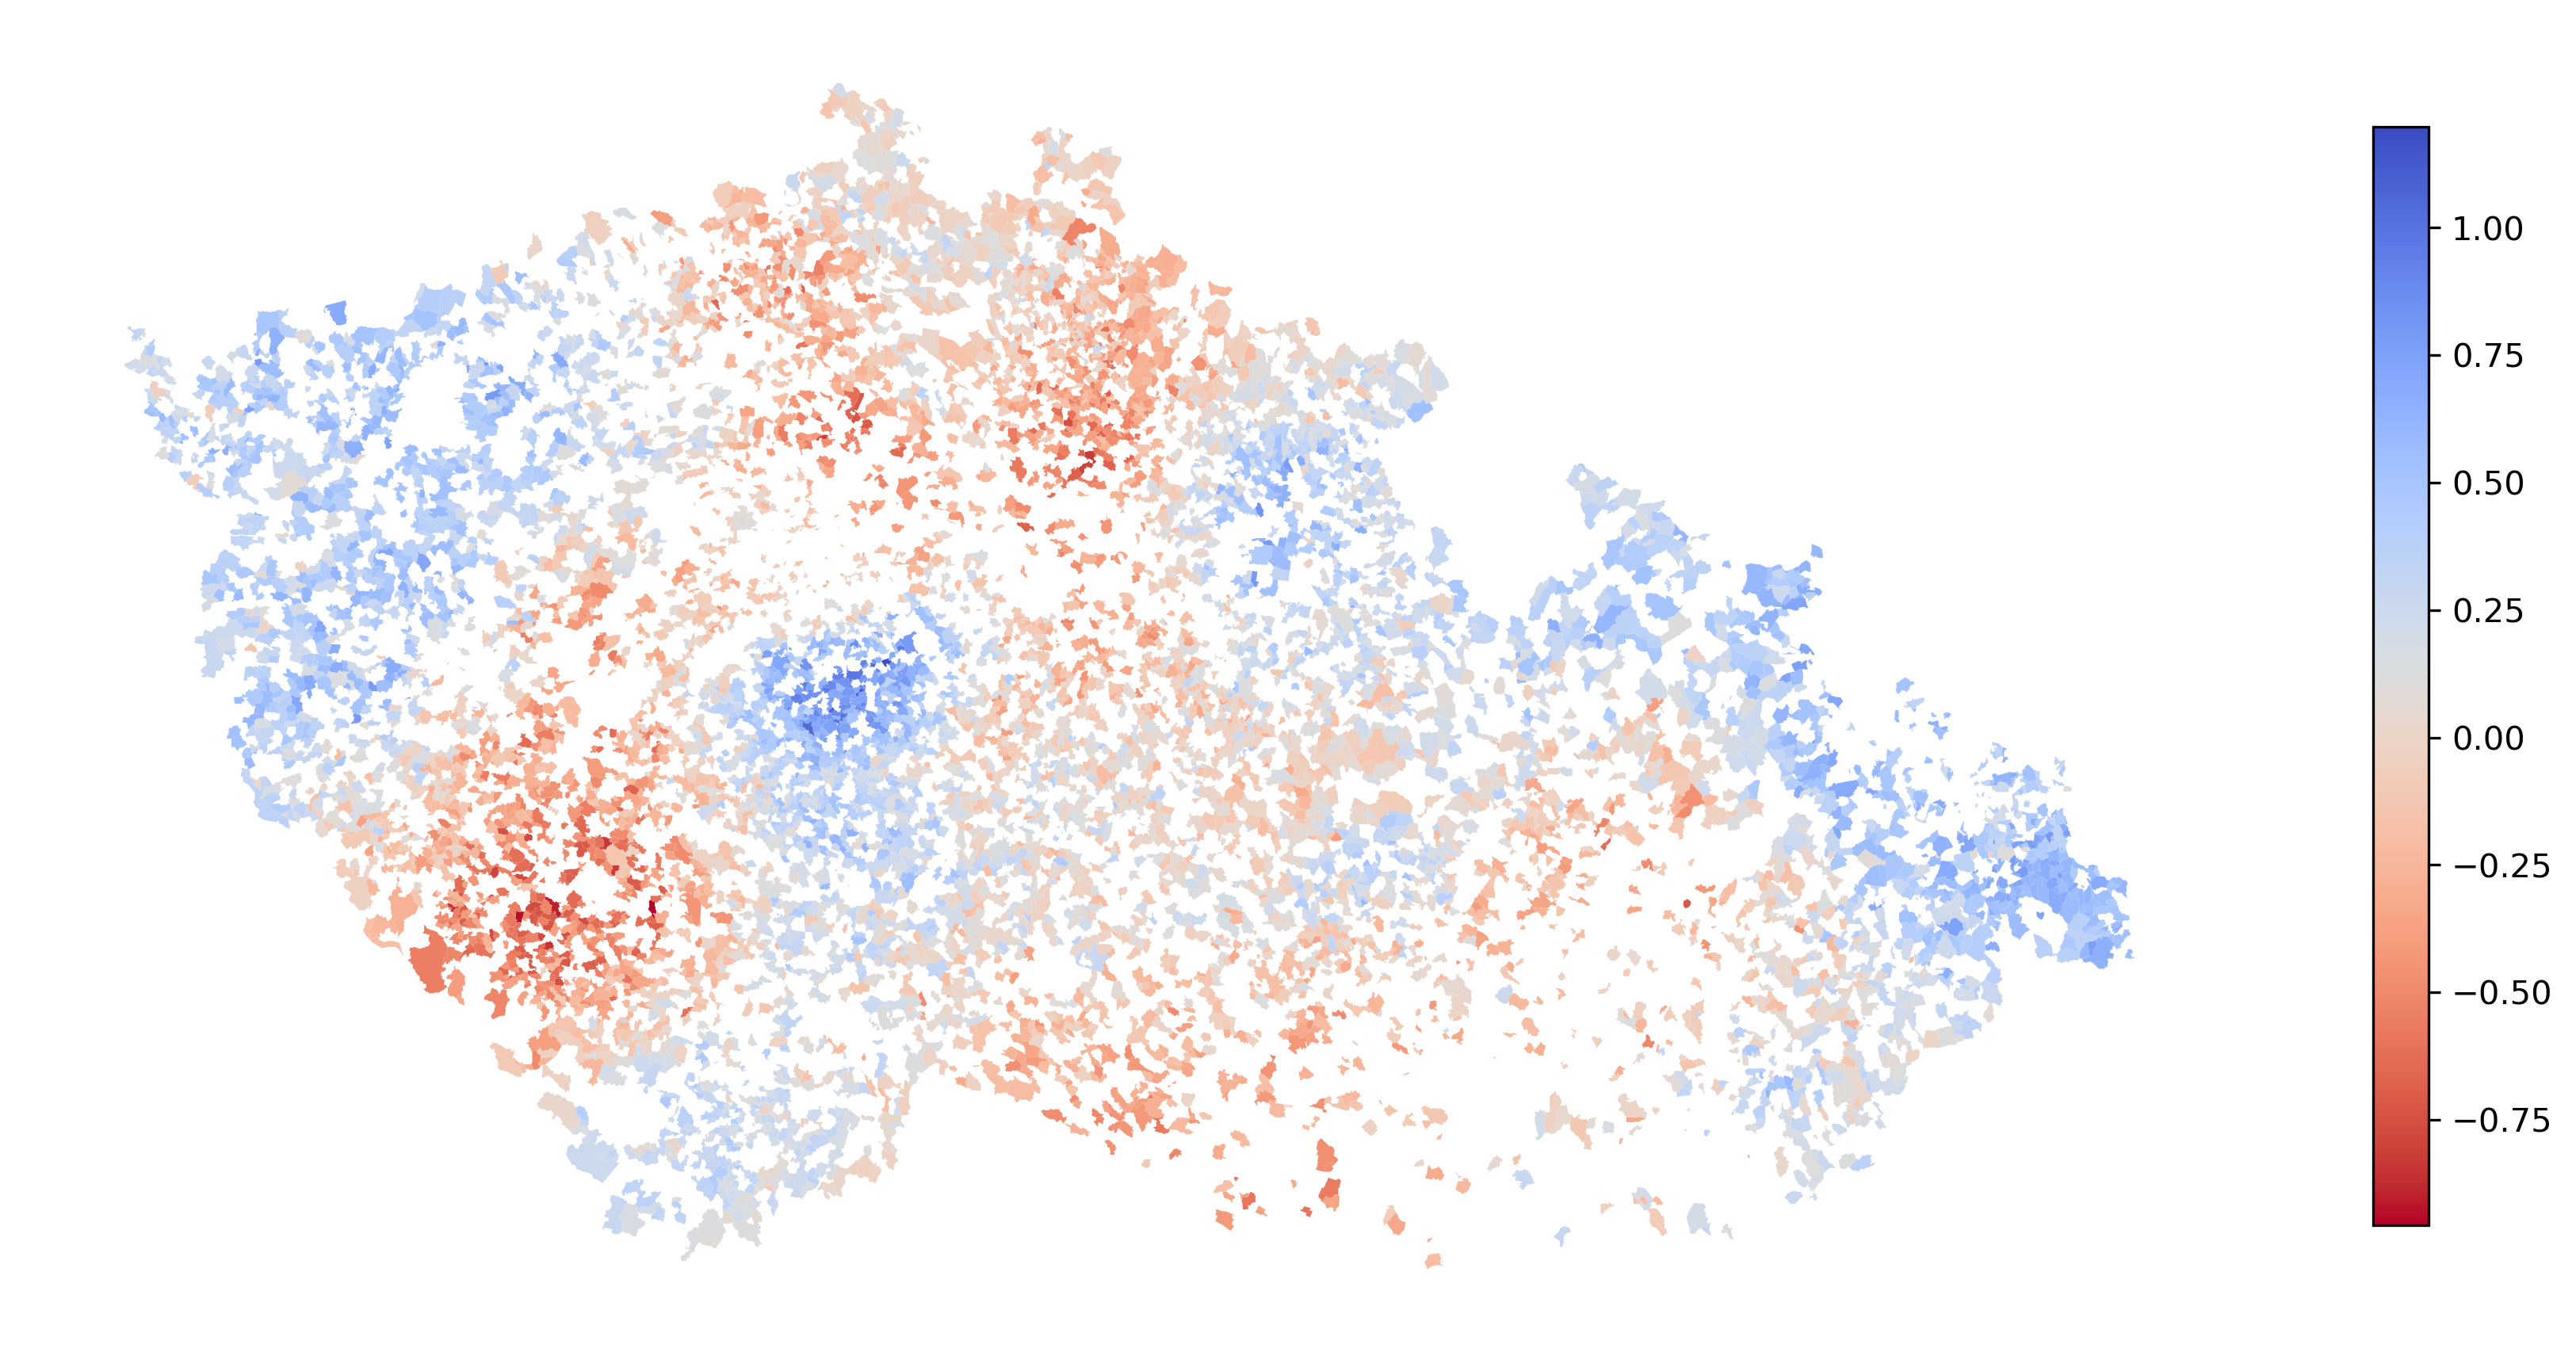
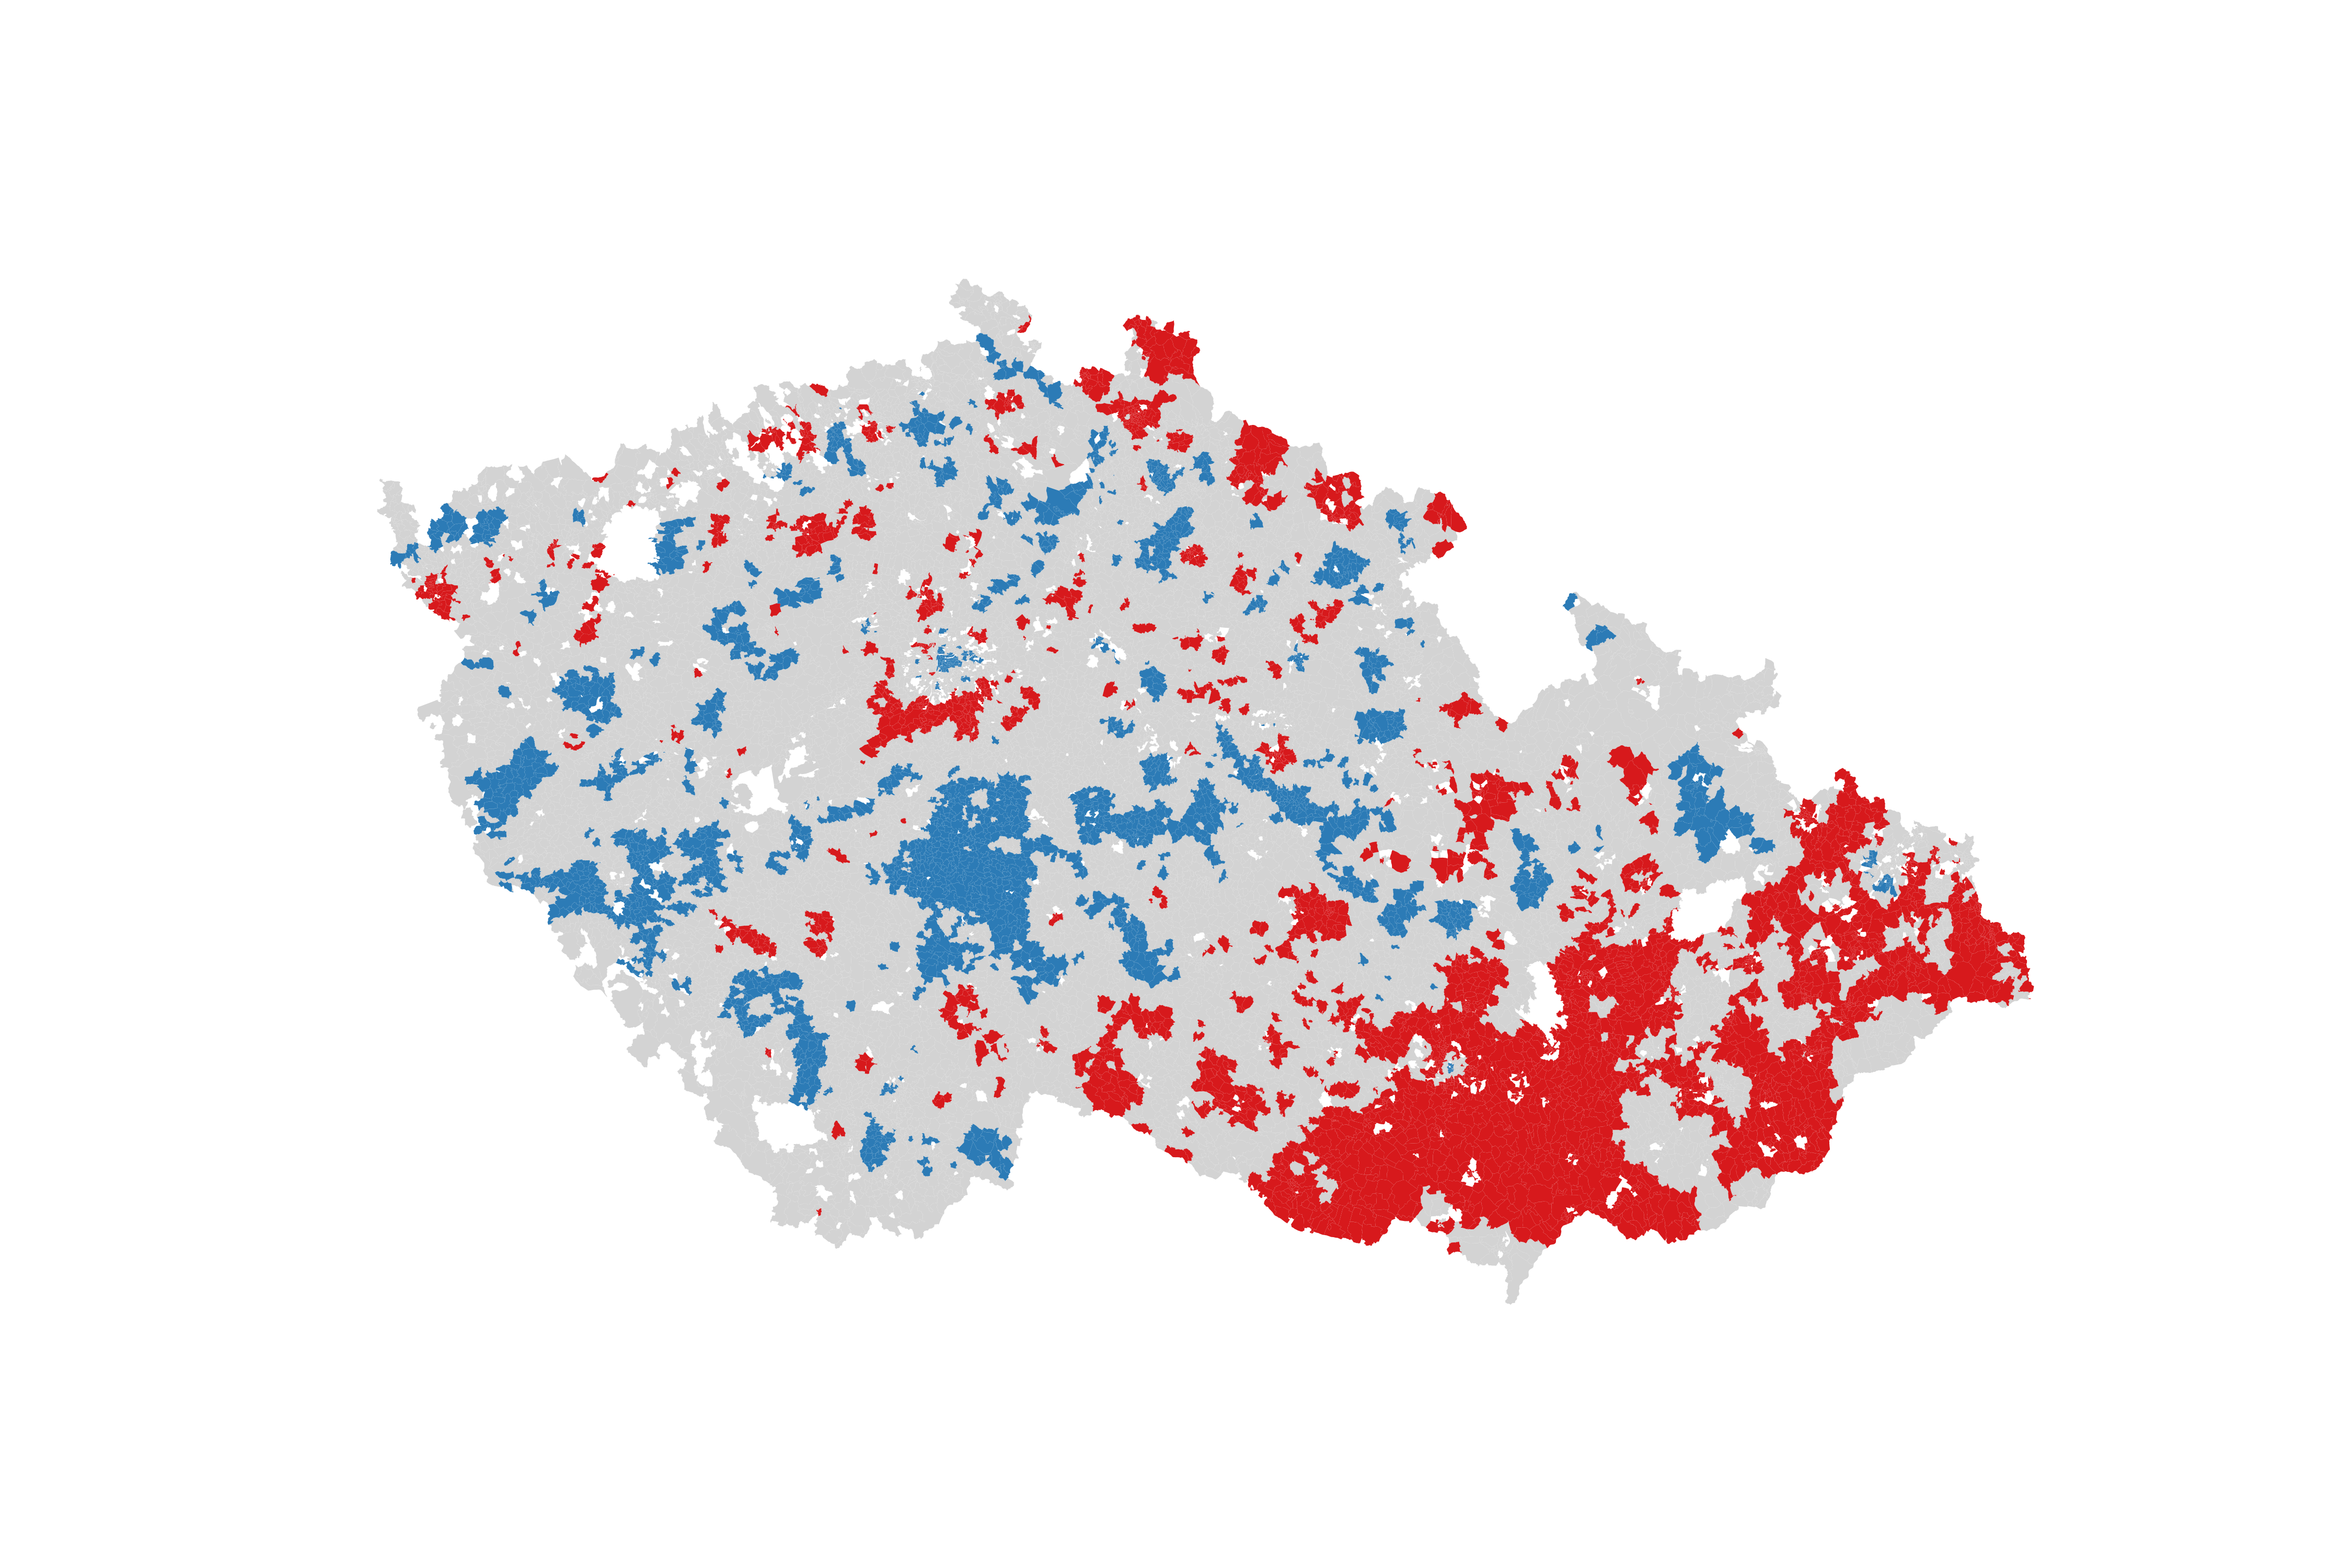
Error
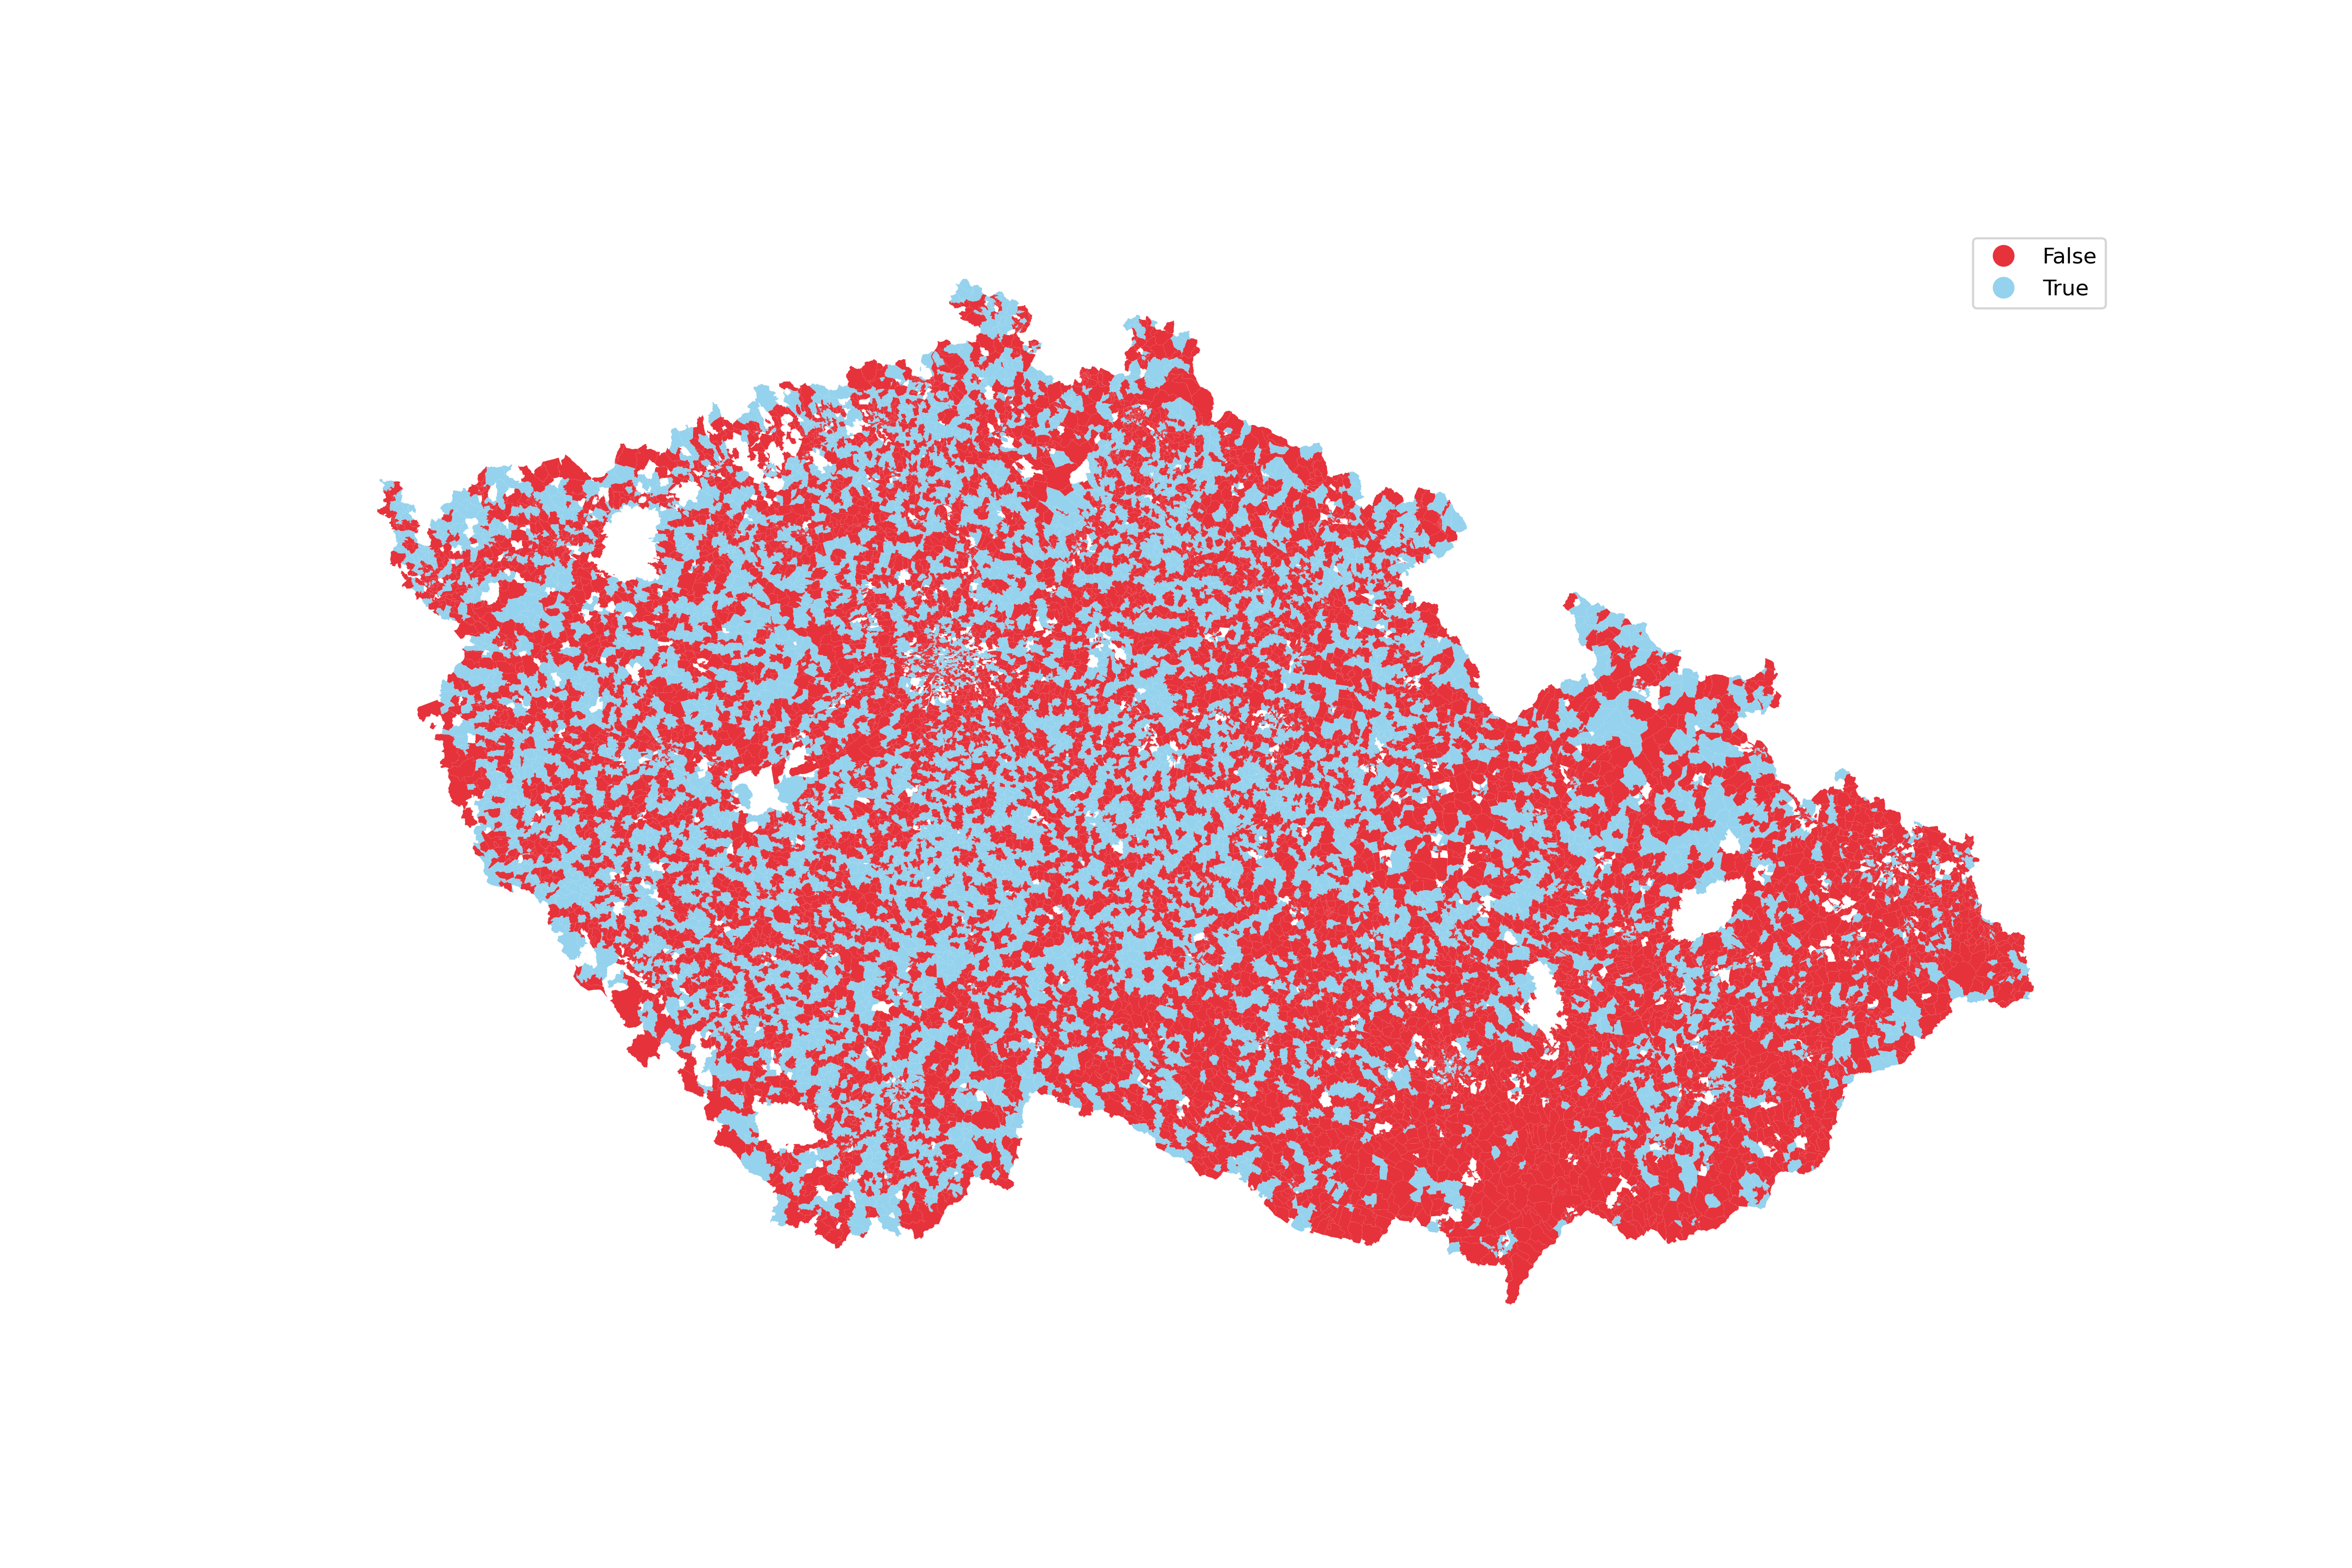
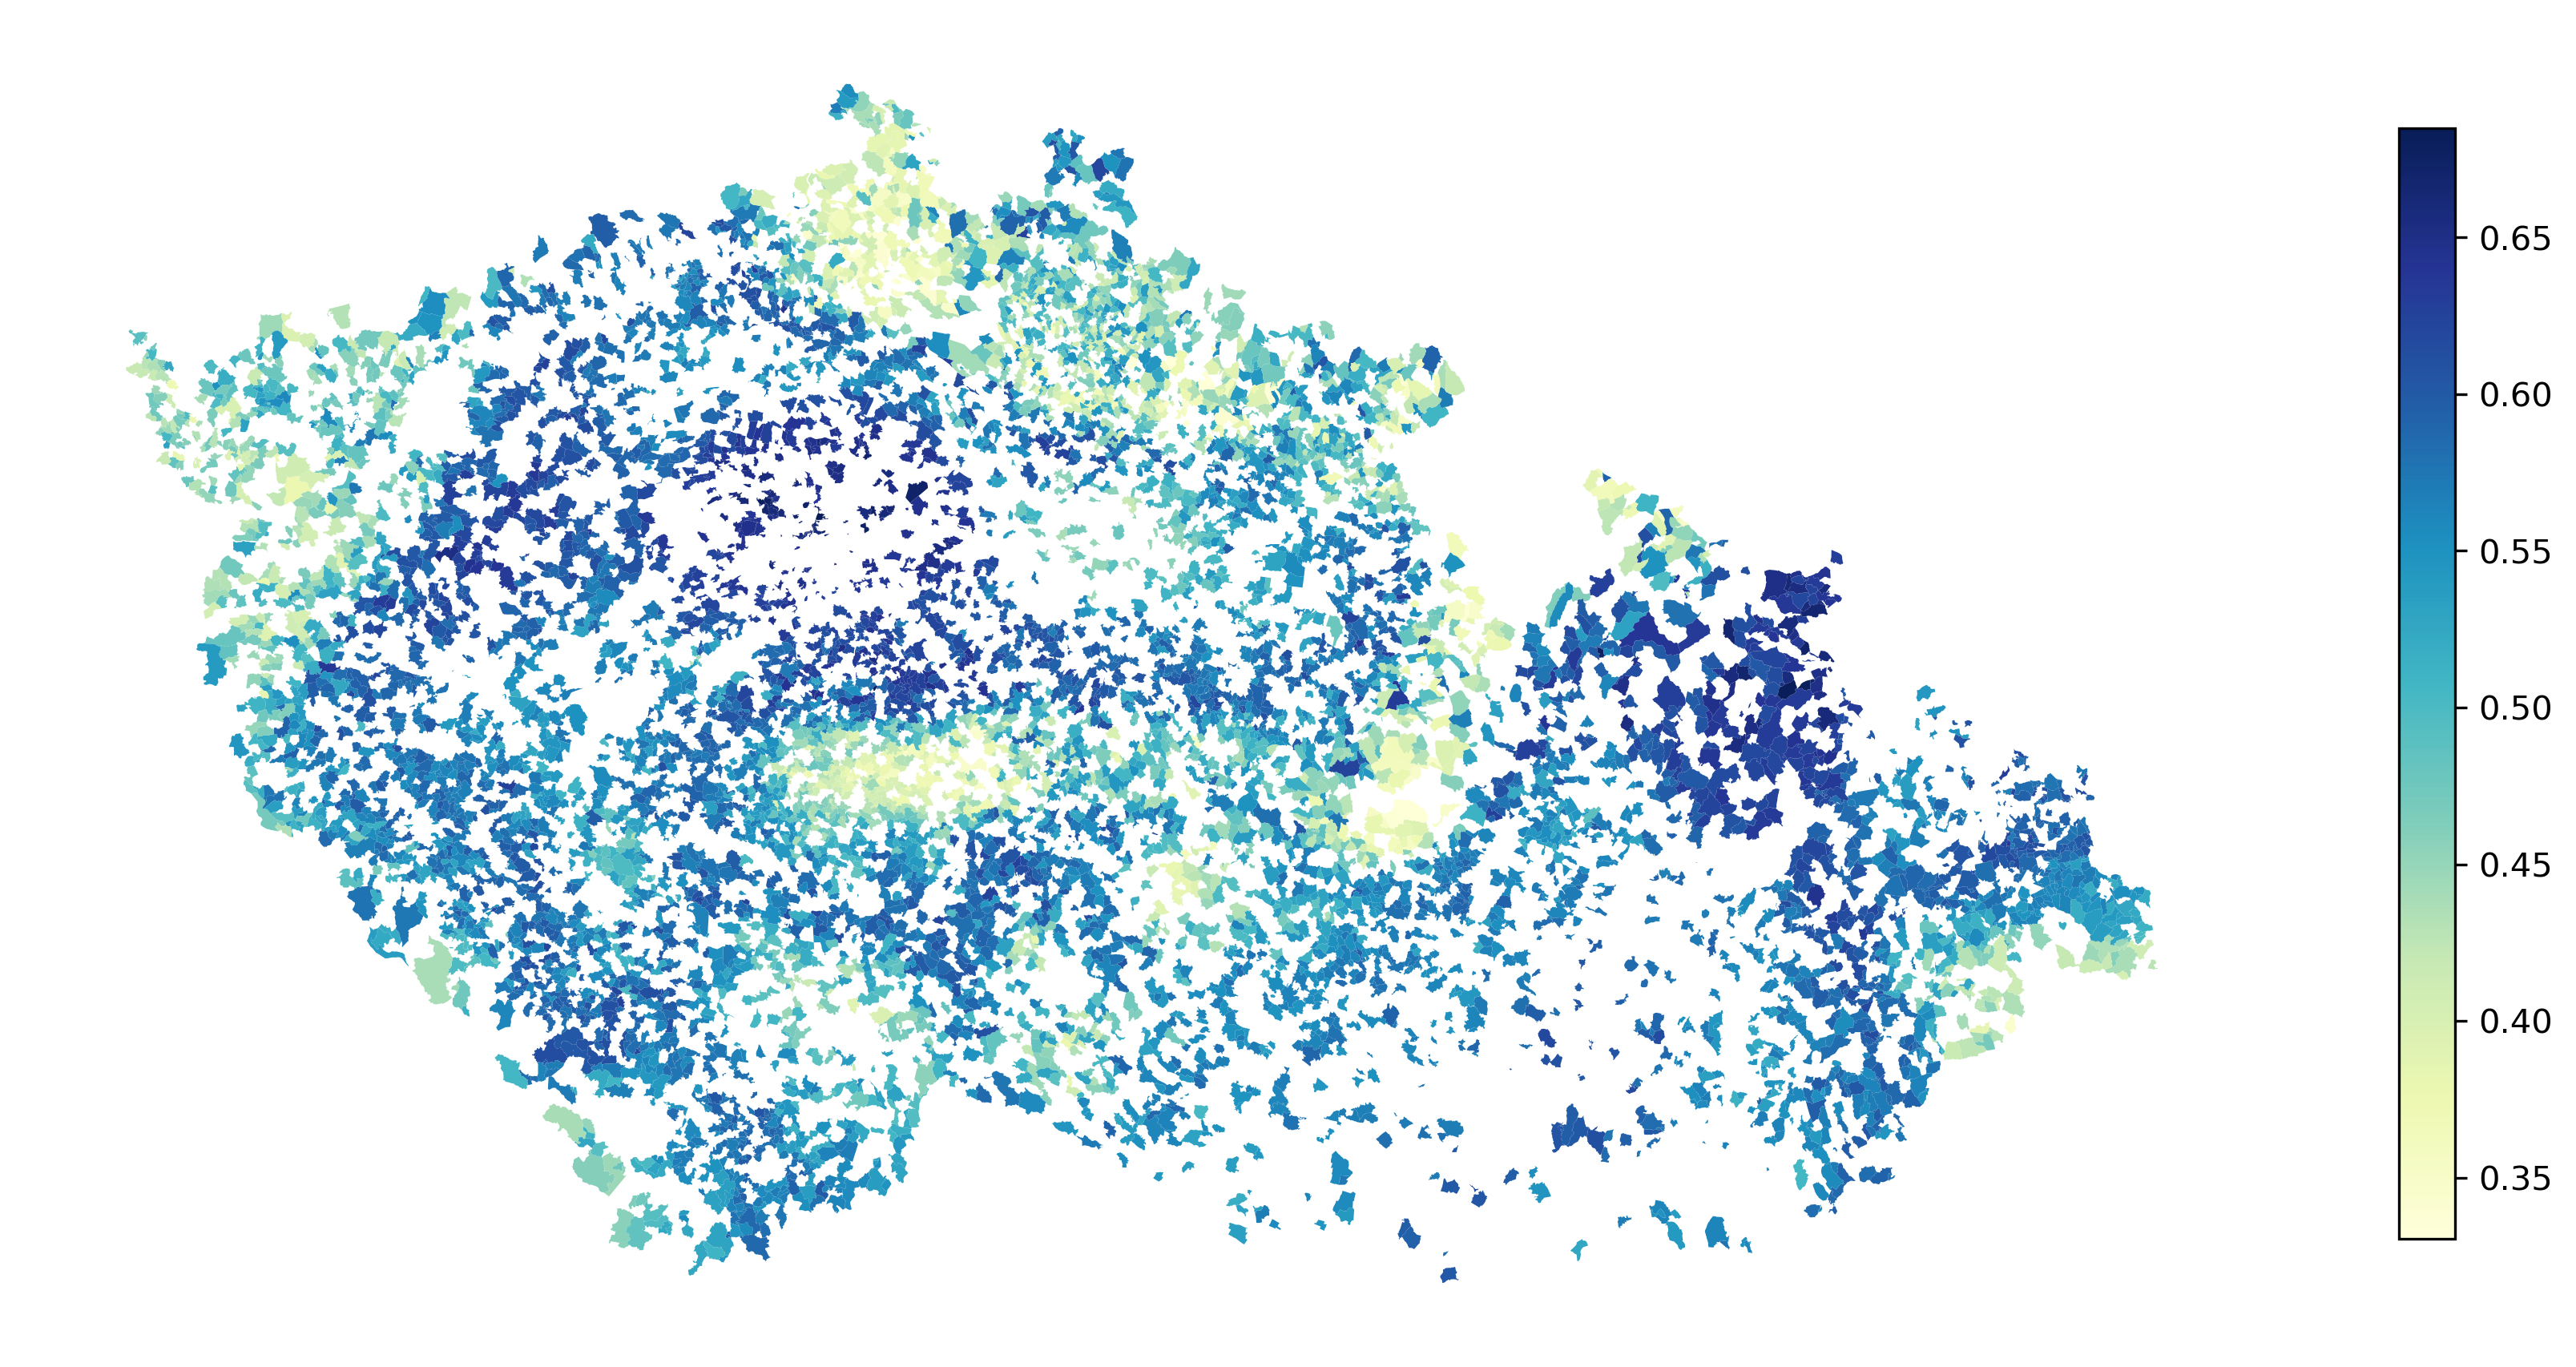
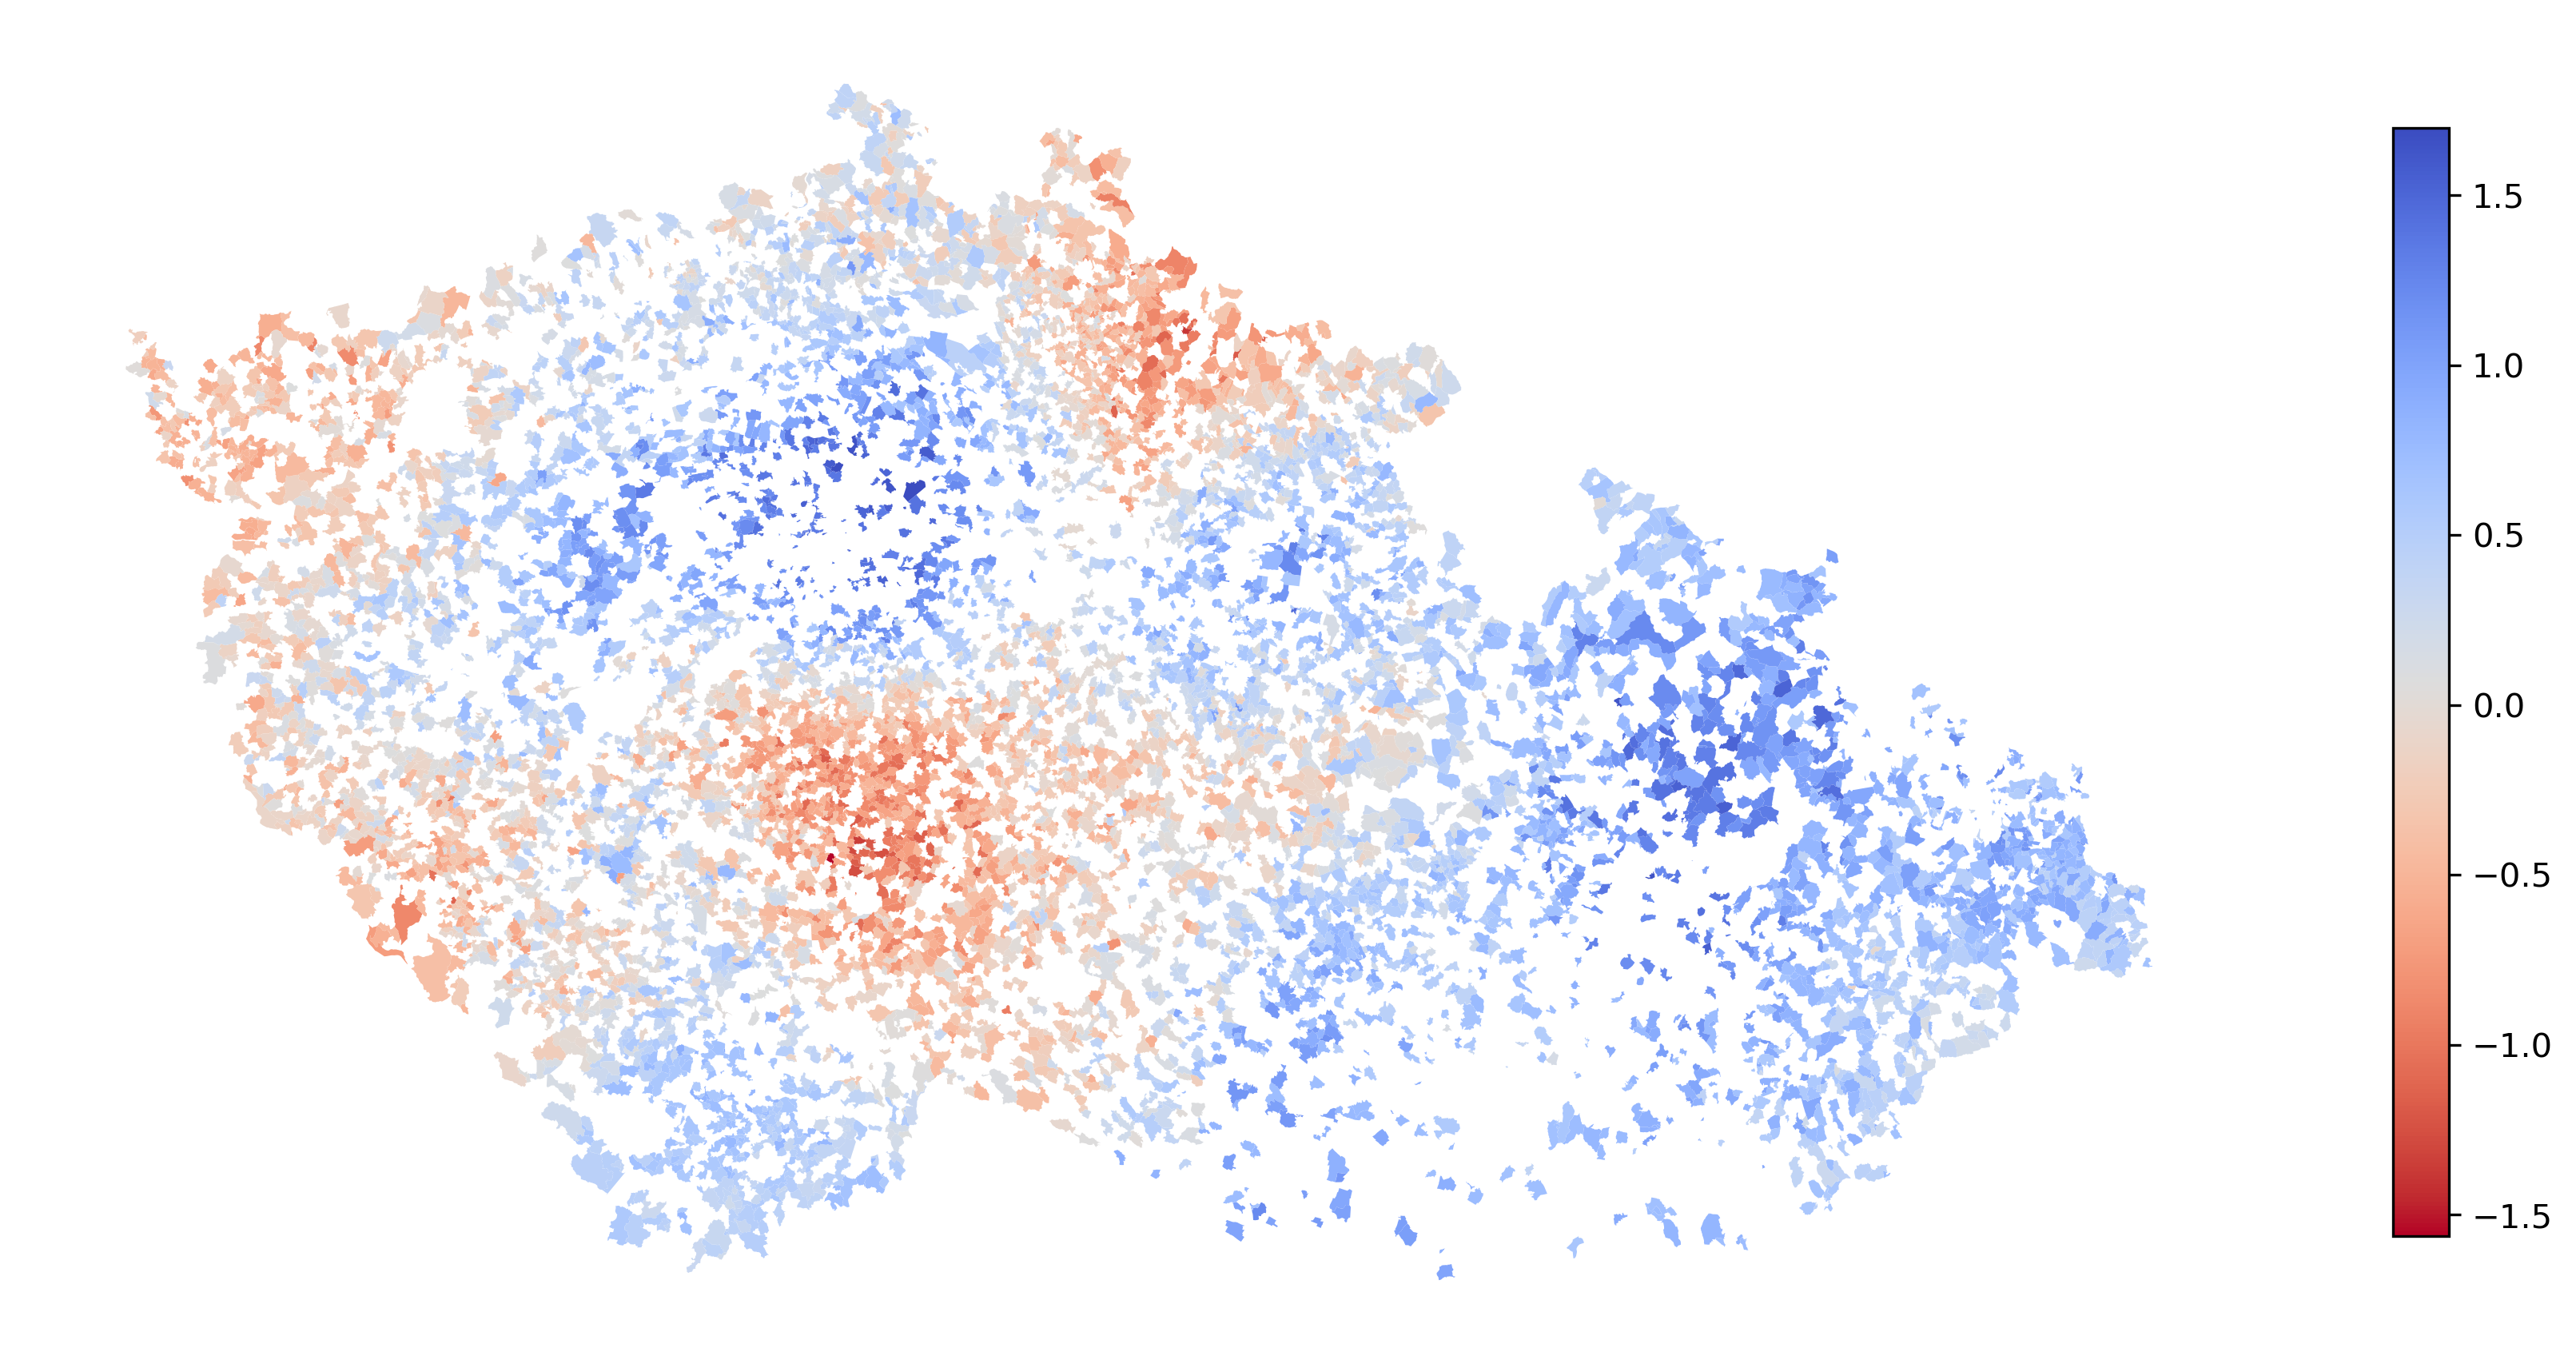
Spatial autocorellation of the error
Weighting
Controlled by a distance-decay parameter.
Nearby observations are given more weight than distant ones.
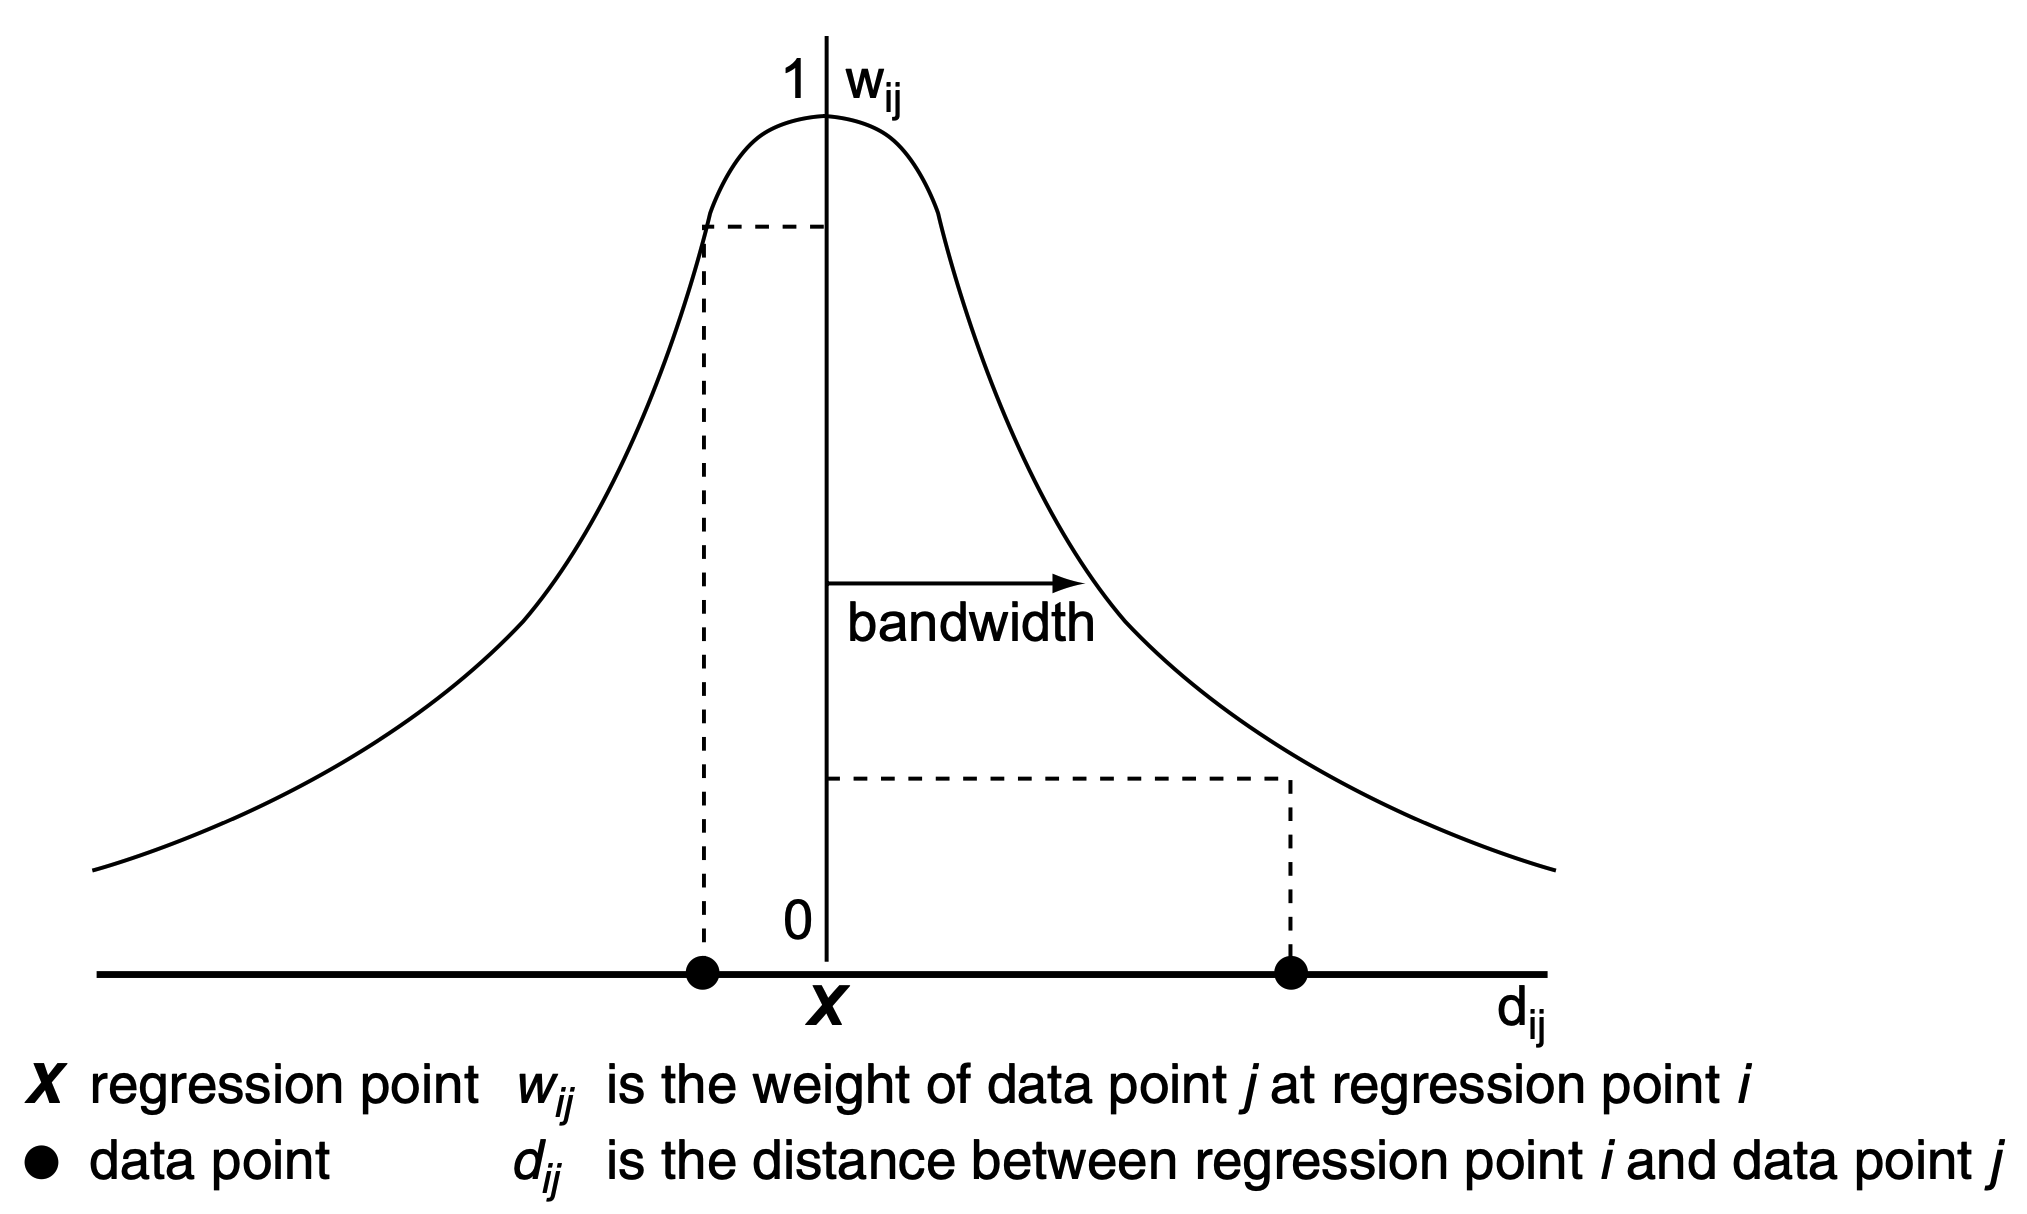
Illustration of bandwidth and its relation to weight, Fotheringham et al. (2002, 44–45)
Bandwidth
Controls the spatial scale over which a process varies.
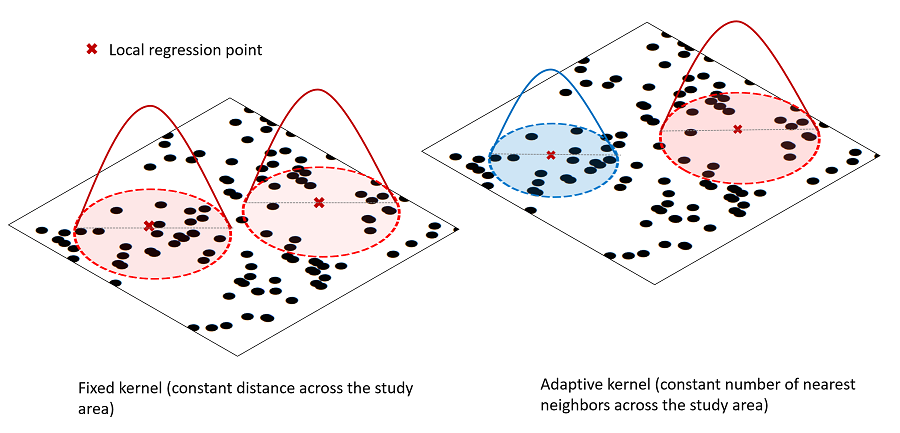
Conceptual diagram explaining fixed (left) and adaptive weighting (right) schemes. Sachdeva, M., & Fotheringham, A. S. (2020)
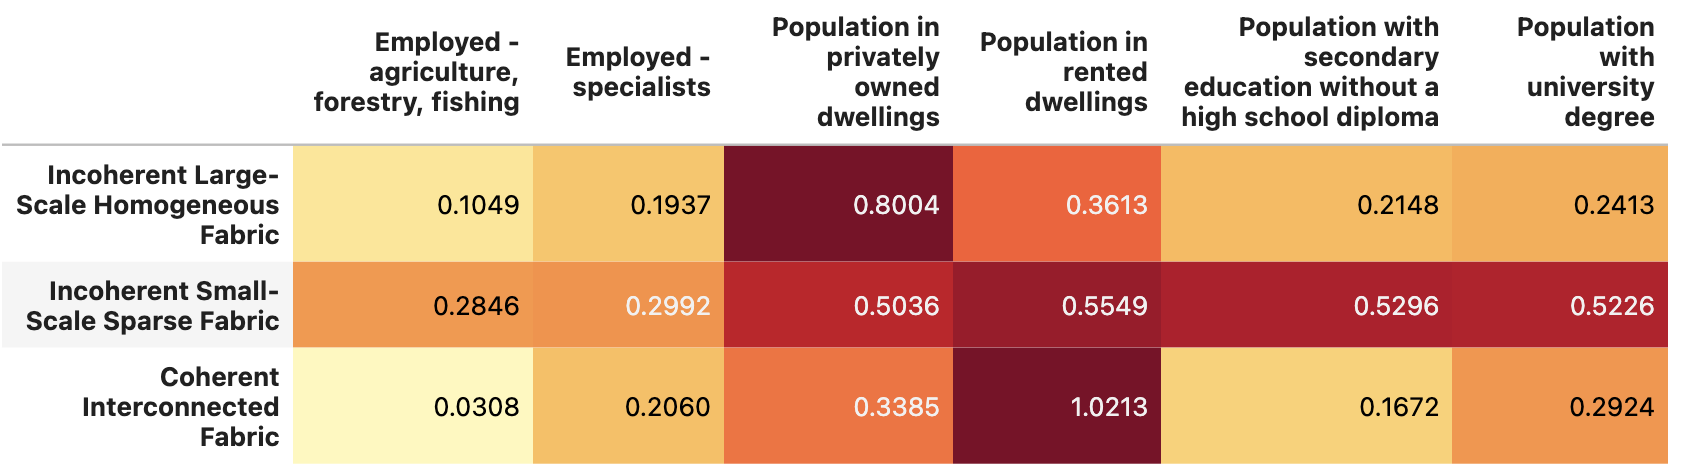
Results
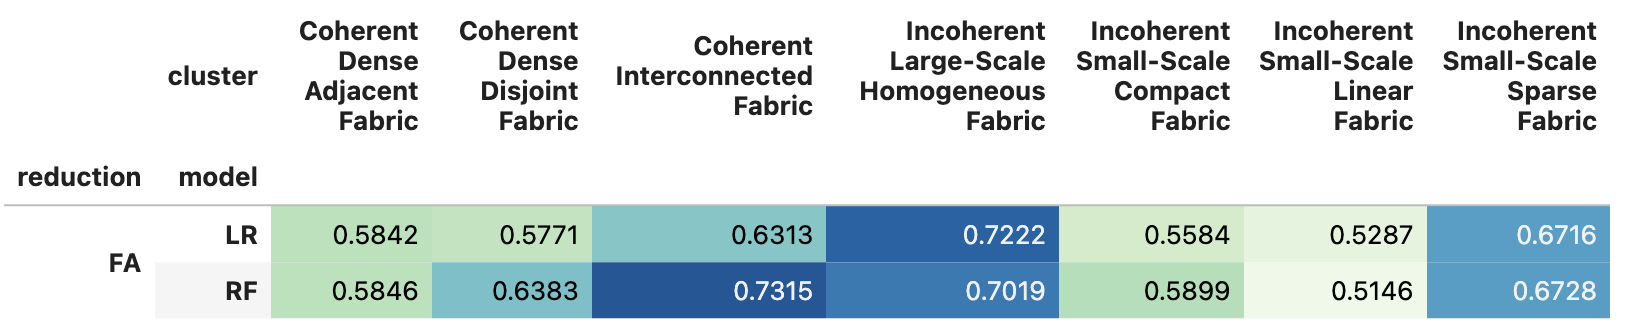
Results
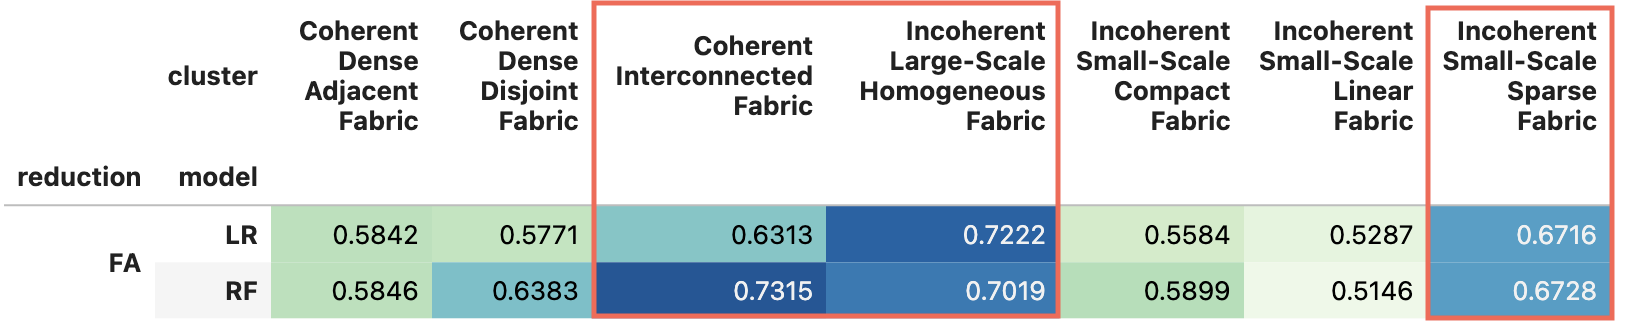
Results
Incoherent Small-Scale Sparse Fabric
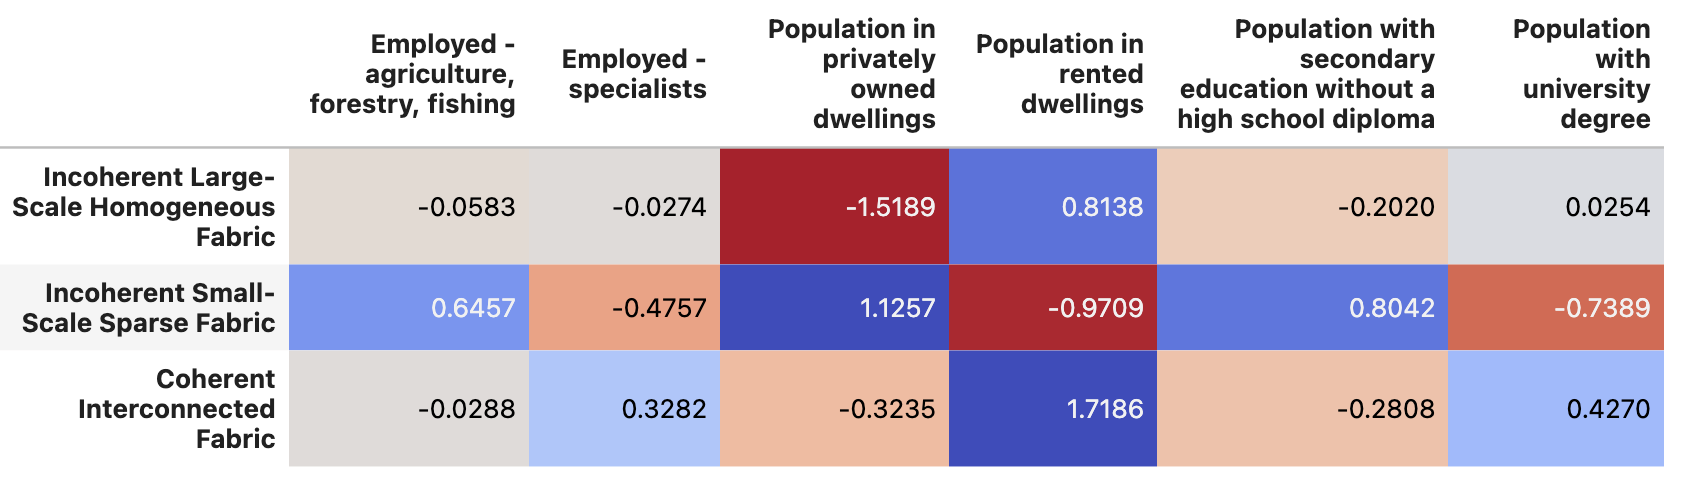
Incoherent Small-Scale Sparse Fabric
Incoherent Small-Scale Sparse Fabric